Bank of America 2011 Annual Report Download - page 26
Download and view the complete annual report
Please find page 26 of the 2011 Bank of America annual report below. You can navigate through the pages in the report by either clicking on the pages listed below, or by using the keyword search tool below to find specific information within the annual report.-
 1
1 -
2
-
3
-
4
-
5
-
6
-
7
-
8
-
9
-
10
-
11
-
12
-
13
-
14
-
15
-
 16
16 -
 17
17 -
 18
18 -
 19
19 -
 20
20 -
 21
21 -
 22
22 -
 23
23 -
 24
24 -
 25
25 -
 26
26 -
 27
27 -
 28
28 -
 29
29 -
 30
30 -
 31
31 -
 32
32 -
 33
33 -
 34
34 -
 35
35 -
 36
36 -
37
-
38
-
39
-
40
-
41
-
42
-
43
-
44
-
45
-
46
-
47
-
48
-
49
-
50
-
51
-
52
-
53
-
54
-
55
-
56
-
57
-
58
-
59
-
60
-
61
-
62
-
63
-
64
-
65
-
66
-
67
-
68
-
69
-
70
-
71
-
72
-
73
-
74
-
75
-
76
-
77
-
78
-
79
-
80
-
81
-
82
-
83
-
84
-
85
-
86
-
87
-
88
-
89
-
90
-
91
-
92
-
93
-
94
-
95
-
96
-
97
-
98
-
99
-
100
-
101
-
102
-
103
-
104
-
105
-
106
-
107
-
108
-
109
-
110
-
111
-
112
-
113
-
114
-
115
-
116
-
117
-
118
-
119
-
120
-
121
-
122
-
123
-
124
-
125
-
126
-
127
-
128
-
129
-
130
-
131
-
132
-
133
-
134
-
135
-
136
-
137
-
138
-
139
-
140
-
141
-
142
-
143
-
144
-
145
-
146
-
147
-
148
-
149
-
150
-
151
-
152
-
153
-
154
-
155
-
156
-
157
-
158
-
159
-
160
-
161
-
162
-
163
-
164
-
165
-
166
-
167
-
168
-
169
-
170
-
171
-
172
-
173
-
174
-
175
-
176
-
177
-
178
-
179
-
180
-
181
-
182
-
183
-
184
-
185
-
186
-
187
-
188
-
189
-
190
-
191
-
192
-
193
-
194
-
195
-
196
-
197
-
198
-
199
-
200
-
201
-
202
-
203
-
204
-
205
-
206
-
207
-
208
-
209
-
210
-
211
-
212
-
213
-
214
-
215
-
216
-
217
-
218
-
219
-
220
-
221
-
222
-
223
-
224
-
225
-
226
-
227
-
228
-
229
-
230
-
231
-
232
-
233
-
234
-
235
-
236
-
237
-
238
-
239
-
240
-
241
-
242
-
243
-
244
-
245
-
246
-
247
-
248
-
249
-
250
-
251
-
252
-
253
-
254
-
255
-
256
-
257
-
258
-
259
-
260
-
261
-
262
-
263
-
264
-
265
-
266
-
267
-
268
-
269
-
270
-
271
-
272
-
273
-
274
-
275
-
276
 |
 |
24 Bank of America 2011
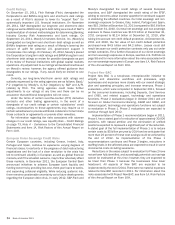
Credit Ratings
On December 15, 2011, Fitch Ratings (Fitch) downgraded the
Corporation’s and BANA’s long-term and short-term debt ratings
as a result of Fitch’s decision to lower its “support floor” for
systemically important U.S. financial institutions. On November
29, 2011, S&P downgraded our long-term and short-term debt
ratings as well as BANA’s long-term debt rating as a result of S&P’s
implementation of revised methodologies for determining Banking
Industry Country Risk Assessments and bank ratings. On
September 21, 2011, Moody’s Investors Service, Inc. (Moody’s)
downgraded our long-term and short-term debt ratings as well as
BANA’s long-term debt rating as a result of Moody’s lowering the
amount of uplift for potential U.S. government support it
incorporates into ratings. On February 15, 2012, Moody’s placed
the Corporation’s long-term debt ratings and BANA’s long-term and
short-term debt ratings on review for possible downgrade as part
of its review of financial institutions with global capital markets
operations. Any adjustment to our ratings will be determined based
on Moody’s review; however, the agency offered guidance that
downgrades to our ratings, if any, would likely be limited to one
notch.
Currently, our long-term/short-term senior debt ratings and
outlooks expressed by the rating agencies are as follows: Baa1/
P-2 (negative) by Moody’s, A-/A-2 (negative) by S&P and A/F1
(stable) by Fitch. The rating agencies could make further
adjustments to our ratings at any time and there can be no
assurance that additional downgrades will not occur.
Under the terms of certain over-the-counter (OTC) derivative
contracts and other trading agreements, in the event of a
downgrade of our credit ratings or certain subsidiaries’ credit
ratings, counterparties to those agreements may require us or
certain subsidiaries to provide additional collateral or to terminate
those contracts or agreements or provide other remedies.
For information regarding the risks associated with adverse
changes in our credit ratings, see Liquidity Risk – Credit Ratings
on page 73, Note 4 – Derivatives to the Consolidated Financial
Statements and Item 1A. Risk Factors of this Annual Report on
Form 10-K.
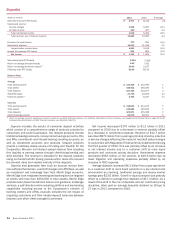
European Union Sovereign Credit Risks
Certain European countries, including Greece, Ireland, Italy,
Portugal and Spain, continue to experience varying degrees of
financial stress. Uncertainty in the progress of debt restructuring
negotiations and the lack of a clear resolution to the crisis has
led to continued volatility in European as well as global financial
markets, and if the situation worsens, may further adversely affect
these markets. In December 2011, the European Central Bank
announced initiatives to address European bank liquidity and
funding concerns by providing low-cost, three-year loans to banks,
and expanding collateral eligibility. While reducing systemic risk,
there remains considerable uncertainty as to future developments
regarding the European debt crisis. In early 2012, S&P, Fitch and
Moody’s downgraded the credit ratings of several European
countries, and S&P downgraded the credit rating of the EFSF,
adding to concerns about investor appetite for continued support
in stabilizing the affected countries. Our total sovereign and non-
sovereign exposure to Greece, Italy, Ireland, Portugal and Spain,
was $15.3 billion at December 31, 2011 compared to $16.6 billion
at December 31, 2010. Our total net sovereign and non-sovereign
exposure to these countries was $10.5 billion at December 31,
2011 compared to $12.4 billion at December 31, 2010, after
taking into account net credit default protection. At December 31,
2011 and 2010, the fair value of net credit default protection
purchased was $4.9 billion and $4.2 billion. Losses could still
result because our credit protection contracts only pay out under
certain scenarios. For a further discussion of our direct sovereign
and non-sovereign exposures in Europe, see Non-U.S. Portfolio on
page 98 and for more information about the risks associated with
our non-sovereign exposures in Europe, see Item 1A. Risk Factors
of this Annual Report on Form 10-K.
Project New BAC
Project New BAC is a two-phase, enterprise-wide initiative to
simplify and streamline workflows and processes, align
businesses and expenses more closely with our overall strategic
plan and operating principles, and increase revenues. Phase 1
evaluations, which were completed in September 2011, focused
on the consumer businesses, including Deposits, Card Services
and CRES, and related support, technology and operations
functions. Phase 2 evaluations began in October 2011 and are
focused on Global Commercial Banking, GBAM and GWIM, and
related support, technology and operations functions not subject
to evaluation in Phase 1. Phase 2 evaluations are expected to
continue through April 2012.
Implementation of Phase 1 recommendations began in 2011.
Phase 1 has a stated goal of a reduction of approximately 30,000
positions, with natural attrition and the elimination of unfilled
positions expected to represent a significant part of the reduction.
A stated goal of the full implementation of Phase 1 is to reduce
certain costs by $5 billion per year by 2014 and we anticipate that
more than 20 percent of these cost savings could be achieved by
the end of 2012. As implementation of the Phase 1
recommendations continues and Phase 2 begins, reductions in
staffing levels in the affected areas are expected to result in some
incremental costs including severance.
Reductions in the areas subject to evaluation for Phase 2 have
not yet been fully identified, and accordingly, potential cost savings
cannot be estimated at this time; however, they are expected to
be lower than Phase 1 because the businesses have lower
headcount. All aspects of New BAC are expected to be
implemented by the end of 2014. There were no material expenses
related to New BAC recorded in 2011. For information about the
risks associated with Project New BAC, see Item 1A. Risk Factors
of this Annual Report on Form 10-K.