RBS 2009 Annual Report Download - page 100
Download and view the complete annual report
Please find page 100 of the 2009 RBS annual report below. You can navigate through the pages in the report by either clicking on the pages listed below, or by using the keyword search tool below to find specific information within the annual report.-
 1
1 -
2
-
3
-
4
-
5
-
6
-
7
-
8
-
9
-
10
-
11
-
12
-
13
-
14
-
15
-
16
-
17
-
18
-
19
-
20
-
21
-
22
-
23
-
24
-
25
-
26
-
27
-
28
-
29
-
30
-
31
-
32
-
33
-
34
-
35
-
36
-
37
-
38
-
39
-
40
-
41
-
42
-
43
-
44
-
45
-
46
-
47
-
48
-
49
-
50
-
51
-
52
-
53
-
54
-
55
-
56
-
57
-
58
-
59
-
60
-
61
-
62
-
63
-
64
-
65
-
66
-
67
-
68
-
69
-
70
-
71
-
72
-
73
-
74
-
75
-
76
-
77
-
78
-
79
-
80
-
81
-
82
-
83
-
84
-
85
-
86
-
87
-
88
-
89
-
 90
90 -
 91
91 -
 92
92 -
 93
93 -
 94
94 -
 95
95 -
 96
96 -
 97
97 -
 98
98 -
 99
99 -
 100
100 -
 101
101 -
 102
102 -
 103
103 -
 104
104 -
 105
105 -
 106
106 -
 107
107 -
 108
108 -
 109
109 -
 110
110 -
111
-
112
-
113
-
114
-
115
-
116
-
117
-
118
-
119
-
120
-
121
-
122
-
123
-
124
-
125
-
126
-
127
-
128
-
129
-
130
-
131
-
132
-
133
-
134
-
135
-
136
-
137
-
138
-
139
-
140
-
141
-
142
-
143
-
144
-
145
-
146
-
147
-
148
-
149
-
150
-
151
-
152
-
153
-
154
-
155
-
156
-
157
-
158
-
159
-
160
-
161
-
162
-
163
-
164
-
165
-
166
-
167
-
168
-
169
-
170
-
171
-
172
-
173
-
174
-
175
-
176
-
177
-
178
-
179
-
180
-
181
-
182
-
183
-
184
-
185
-
186
-
187
-
188
-
189
-
190
-
191
-
192
-
193
-
194
-
195
-
196
-
197
-
198
-
199
-
200
-
201
-
202
-
203
-
204
-
205
-
206
-
207
-
208
-
209
-
210
-
211
-
212
-
213
-
214
-
215
-
216
-
217
-
218
-
219
-
220
-
221
-
222
-
223
-
224
-
225
-
226
-
227
-
228
-
229
-
230
-
231
-
232
-
233
-
234
-
235
-
236
-
237
-
238
-
239
-
240
-
241
-
242
-
243
-
244
-
245
-
246
-
247
-
248
-
249
-
250
-
251
-
252
-
253
-
254
-
255
-
256
-
257
-
258
-
259
-
260
-
261
-
262
-
263
-
264
-
265
-
266
-
267
-
268
-
269
-
270
-
271
-
272
-
273
-
274
-
275
-
276
-
277
-
278
-
279
-
280
-
281
-
282
-
283
-
284
-
285
-
286
-
287
-
288
-
289
-
290
-
291
-
292
-
293
-
294
-
295
-
296
-
297
-
298
-
299
-
300
-
301
-
302
-
303
-
304
-
305
-
306
-
307
-
308
-
309
-
310
-
311
-
312
-
313
-
314
-
315
-
316
-
317
-
318
-
319
-
320
-
321
-
322
-
323
-
324
-
325
-
326
-
327
-
328
-
329
-
330
-
331
-
332
-
333
-
334
-
335
-
336
-
337
-
338
-
339
-
340
-
341
-
342
-
343
-
344
-
345
-
346
-
347
-
348
-
349
-
350
-
351
-
352
-
353
-
354
-
355
-
356
-
357
-
358
-
359
-
360
-
361
-
362
-
363
-
364
-
365
-
366
-
367
-
368
-
369
-
370
-
371
-
372
-
373
-
374
-
375
-
376
-
377
-
378
-
379
-
380
-
381
-
382
-
383
-
384
-
385
-
386
-
387
-
388
-
389
-
390
 |
 |

RBS Group Annual Report and Accounts 200998
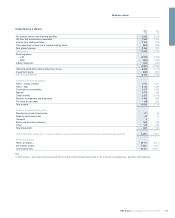
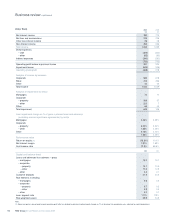
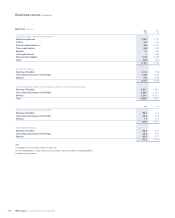
US Retail & Commercial 2009 2008
£m £m
Net interest income 1,775 1,726
Net fees and commissions 714 664
Other non-interest income 235 197
Non-interest income 949 861
Total income 2,724 2,587
Direct expenses
– staff (776) (645)
– other (593) (354)
Indirect expenses (766) (623)
(2,135) (1,622)
Operating profit before impairment losses 589 965
Impairment losses (702) (437)
Operating (loss)/profit (113) 528
Analysis of income by product
Mortgages and home equity 499 375
Personal lending and cards 451 333
Retail deposits 828 1,000
Commercial lending 542 405
Commercial deposits 398 377
Other 697
Total income 2,724 2,587
Average exchange rate – US$/£ 1.566 1.853
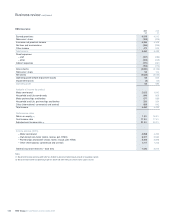
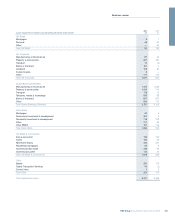
Analysis of impairment by sector
Residential mortgages 72 41
Home equity 167 67
Corporate & Commercial 326 181
Other consumer 137 148
Total impairment 702 437
Loan impairment charge as % of gross customer loans and advances (excluding reverse repurchase agreements) by sector
Residential mortgages 1.11% 0.43%
Home equity 1.08% 0.36%
Corporate & Commercial 1.67% 0.76%
Other consumer 1.84% 1.51%
1.44% 0.71%
Performance ratios
Return on equity (1) (1.8%) 7.7%
Net interest margin 2.37% 2.68%
Cost:income ratio 78.3% 62.7%
US$bn US$bn
Capital and balance sheet
Total assets 121.3 127.8
Loans and advances to customers – gross
– residential mortgages 10.6 13.9
– home equity 25.0 27.2
– corporate and commercial 31.6 34.7
– other consumer 12.1 14.3
Customer deposits 97.4 93.4
Risk elements in lending
–retail 0.6 0.3
– commercial 0.4 0.2
Loan: deposit ratio 80% 96%
Risk-weighted assets 96.9 93.2
Spot exchange rate – US$/£ 1.622 1.460
Note:
(1) Excluding reverse repurchase agreements by sector.
Business review continued