RBS 2009 Annual Report Download - page 198
Download and view the complete annual report
Please find page 198 of the 2009 RBS annual report below. You can navigate through the pages in the report by either clicking on the pages listed below, or by using the keyword search tool below to find specific information within the annual report.-
 1
1 -
2
-
3
-
4
-
5
-
6
-
7
-
8
-
9
-
10
-
11
-
12
-
13
-
14
-
15
-
16
-
17
-
18
-
19
-
20
-
21
-
22
-
23
-
24
-
25
-
26
-
27
-
28
-
29
-
30
-
31
-
32
-
33
-
34
-
35
-
36
-
37
-
38
-
39
-
40
-
41
-
42
-
43
-
44
-
45
-
46
-
47
-
48
-
49
-
50
-
51
-
52
-
53
-
54
-
55
-
56
-
57
-
58
-
59
-
60
-
61
-
62
-
63
-
64
-
65
-
66
-
67
-
68
-
69
-
70
-
71
-
72
-
73
-
74
-
75
-
76
-
77
-
78
-
79
-
80
-
81
-
82
-
83
-
84
-
85
-
86
-
87
-
88
-
89
-
90
-
91
-
92
-
93
-
94
-
95
-
96
-
97
-
98
-
99
-
100
-
101
-
102
-
103
-
104
-
105
-
106
-
107
-
108
-
109
-
110
-
111
-
112
-
113
-
114
-
115
-
116
-
117
-
118
-
119
-
120
-
121
-
122
-
123
-
124
-
125
-
126
-
127
-
128
-
129
-
130
-
131
-
132
-
133
-
134
-
135
-
136
-
137
-
138
-
139
-
140
-
141
-
142
-
143
-
144
-
145
-
146
-
147
-
148
-
149
-
150
-
151
-
152
-
153
-
154
-
155
-
156
-
157
-
158
-
159
-
160
-
161
-
162
-
163
-
164
-
165
-
166
-
167
-
168
-
169
-
170
-
171
-
172
-
173
-
174
-
175
-
176
-
177
-
178
-
179
-
180
-
181
-
182
-
183
-
184
-
185
-
186
-
187
-
 188
188 -
 189
189 -
 190
190 -
 191
191 -
 192
192 -
 193
193 -
 194
194 -
 195
195 -
 196
196 -
 197
197 -
 198
198 -
 199
199 -
 200
200 -
 201
201 -
 202
202 -
 203
203 -
 204
204 -
 205
205 -
 206
206 -
 207
207 -
 208
208 -
209
-
210
-
211
-
212
-
213
-
214
-
215
-
216
-
217
-
218
-
219
-
220
-
221
-
222
-
223
-
224
-
225
-
226
-
227
-
228
-
229
-
230
-
231
-
232
-
233
-
234
-
235
-
236
-
237
-
238
-
239
-
240
-
241
-
242
-
243
-
244
-
245
-
246
-
247
-
248
-
249
-
250
-
251
-
252
-
253
-
254
-
255
-
256
-
257
-
258
-
259
-
260
-
261
-
262
-
263
-
264
-
265
-
266
-
267
-
268
-
269
-
270
-
271
-
272
-
273
-
274
-
275
-
276
-
277
-
278
-
279
-
280
-
281
-
282
-
283
-
284
-
285
-
286
-
287
-
288
-
289
-
290
-
291
-
292
-
293
-
294
-
295
-
296
-
297
-
298
-
299
-
300
-
301
-
302
-
303
-
304
-
305
-
306
-
307
-
308
-
309
-
310
-
311
-
312
-
313
-
314
-
315
-
316
-
317
-
318
-
319
-
320
-
321
-
322
-
323
-
324
-
325
-
326
-
327
-
328
-
329
-
330
-
331
-
332
-
333
-
334
-
335
-
336
-
337
-
338
-
339
-
340
-
341
-
342
-
343
-
344
-
345
-
346
-
347
-
348
-
349
-
350
-
351
-
352
-
353
-
354
-
355
-
356
-
357
-
358
-
359
-
360
-
361
-
362
-
363
-
364
-
365
-
366
-
367
-
368
-
369
-
370
-
371
-
372
-
373
-
374
-
375
-
376
-
377
-
378
-
379
-
380
-
381
-
382
-
383
-
384
-
385
-
386
-
387
-
388
-
389
-
390
 |
 |

Business review continued
RBS Group Annual Report and Accounts 2009196
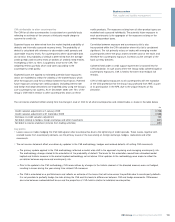
Market turmoil exposures continued
Credit valuation adjustments continued
Monoline insurers continued
A number of debt instruments with monoline protection were reclassified
from held-for-trading to available-for-sale with effect from 1 July 2008.
Changes in the fair value since the reclassification are only recognised
in the income statement to the extent that they are considered
impairments. Changes in the fair value of the related monoline
protection continues to be recorded in the income statement. Higher
prices of these debt securities in 2009 gave rise to net losses from the
corresponding decrease in the gross mark-to-market of the related
monoline protection. The reclassification gave rise to profits in 2008.
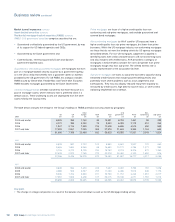
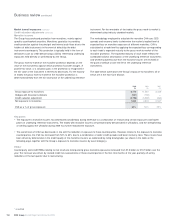
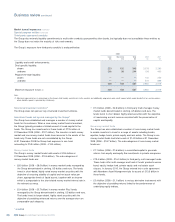
A summary of the reclassified debt securities held at 31 December
2009 are shown in the table below:
£m
Fair value at 1 July 2008 (1) 6,248
Fair value at 31 December 2009 (2) 5,022
Notes:
(1) Represents the fair value of the reclassified debt securities, adjusted for principal based cash flows between 1 July 2008 and 31 December 2009.
(2) Of the net change in fair value, fair value losses of £563 million have not been recognised in the income statement.
If the debt securities had not been reclassified, all changes in fair value
would have been recognised in the income statement and would be off-
set by changes in the fair value of the related monoline CDS. The extent
to which the level of impairments recorded differs from the fair value
changes gives rise to a net profit or loss that, but for the reclassification,
would have been recorded for accounting purposes.
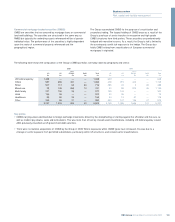
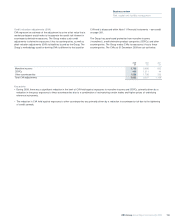
The net income statement effect relating to monoline exposures is shown
below.
£m
Credit valuation adjustment at 1 January 2009 (5,988)
Credit valuation adjustment at 31 December 2009 (3,796)
Decrease in credit valuation adjustment 2,192
Net debit relating to realisation, hedges, foreign exchange and other movements (3,290)
Net debit relating to reclassified debt securities (1,468)
Net debit to income statement (1) (2,566)
Note:
(1) Comprises a loss of £2,387 million recorded as income from trading activities, £239 million of impairment losses and £60 million of other income relating to reclassified debt securities.
Key points
•Realised losses arising from restructuring certain exposures, together with the impact of the US dollar weakening against sterling, are the primary
components of the £3.3 billion above.
•The net loss arising from the reclassification of debt securities is due to the difference between impairment losses on these available-for-sale
securities and the gains that would have been reported in the income statement if these assets had continued to be accounted for as held-for-
trading.
The Group also has indirect exposures to monoline insurers through
wrapped securities and other assets with credit enhancement provided
by monoline insurers. These securities are traded with the benefit of this
credit enhancement. Any deterioration in the credit rating of the monoline
is reflected in the fair value of these assets.