RBS 2009 Annual Report Download - page 249
Download and view the complete annual report
Please find page 249 of the 2009 RBS annual report below. You can navigate through the pages in the report by either clicking on the pages listed below, or by using the keyword search tool below to find specific information within the annual report.-
 1
1 -
2
-
3
-
4
-
5
-
6
-
7
-
8
-
9
-
10
-
11
-
12
-
13
-
14
-
15
-
16
-
17
-
18
-
19
-
20
-
21
-
22
-
23
-
24
-
25
-
26
-
27
-
28
-
29
-
30
-
31
-
32
-
33
-
34
-
35
-
36
-
37
-
38
-
39
-
40
-
41
-
42
-
43
-
44
-
45
-
46
-
47
-
48
-
49
-
50
-
51
-
52
-
53
-
54
-
55
-
56
-
57
-
58
-
59
-
60
-
61
-
62
-
63
-
64
-
65
-
66
-
67
-
68
-
69
-
70
-
71
-
72
-
73
-
74
-
75
-
76
-
77
-
78
-
79
-
80
-
81
-
82
-
83
-
84
-
85
-
86
-
87
-
88
-
89
-
90
-
91
-
92
-
93
-
94
-
95
-
96
-
97
-
98
-
99
-
100
-
101
-
102
-
103
-
104
-
105
-
106
-
107
-
108
-
109
-
110
-
111
-
112
-
113
-
114
-
115
-
116
-
117
-
118
-
119
-
120
-
121
-
122
-
123
-
124
-
125
-
126
-
127
-
128
-
129
-
130
-
131
-
132
-
133
-
134
-
135
-
136
-
137
-
138
-
139
-
140
-
141
-
142
-
143
-
144
-
145
-
146
-
147
-
148
-
149
-
150
-
151
-
152
-
153
-
154
-
155
-
156
-
157
-
158
-
159
-
160
-
161
-
162
-
163
-
164
-
165
-
166
-
167
-
168
-
169
-
170
-
171
-
172
-
173
-
174
-
175
-
176
-
177
-
178
-
179
-
180
-
181
-
182
-
183
-
184
-
185
-
186
-
187
-
188
-
189
-
190
-
191
-
192
-
193
-
194
-
195
-
196
-
197
-
198
-
199
-
200
-
201
-
202
-
203
-
204
-
205
-
206
-
207
-
208
-
209
-
210
-
211
-
212
-
213
-
214
-
215
-
216
-
217
-
218
-
219
-
220
-
221
-
222
-
223
-
224
-
225
-
226
-
227
-
228
-
229
-
230
-
231
-
232
-
233
-
234
-
235
-
236
-
237
-
238
-
 239
239 -
 240
240 -
 241
241 -
 242
242 -
 243
243 -
 244
244 -
 245
245 -
 246
246 -
 247
247 -
 248
248 -
 249
249 -
 250
250 -
 251
251 -
 252
252 -
 253
253 -
 254
254 -
 255
255 -
 256
256 -
 257
257 -
 258
258 -
 259
259 -
260
-
261
-
262
-
263
-
264
-
265
-
266
-
267
-
268
-
269
-
270
-
271
-
272
-
273
-
274
-
275
-
276
-
277
-
278
-
279
-
280
-
281
-
282
-
283
-
284
-
285
-
286
-
287
-
288
-
289
-
290
-
291
-
292
-
293
-
294
-
295
-
296
-
297
-
298
-
299
-
300
-
301
-
302
-
303
-
304
-
305
-
306
-
307
-
308
-
309
-
310
-
311
-
312
-
313
-
314
-
315
-
316
-
317
-
318
-
319
-
320
-
321
-
322
-
323
-
324
-
325
-
326
-
327
-
328
-
329
-
330
-
331
-
332
-
333
-
334
-
335
-
336
-
337
-
338
-
339
-
340
-
341
-
342
-
343
-
344
-
345
-
346
-
347
-
348
-
349
-
350
-
351
-
352
-
353
-
354
-
355
-
356
-
357
-
358
-
359
-
360
-
361
-
362
-
363
-
364
-
365
-
366
-
367
-
368
-
369
-
370
-
371
-
372
-
373
-
374
-
375
-
376
-
377
-
378
-
379
-
380
-
381
-
382
-
383
-
384
-
385
-
386
-
387
-
388
-
389
-
390
 |
 |

Financial statements
247RBS Group Annual Report and Accounts 2009
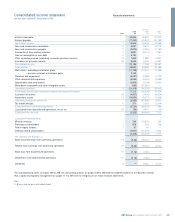
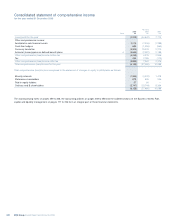
Cash flow statements
for the year ended 31 December 2009
Group Company
Restated
2009 2008 2007 2009 2008 2007
Note £m £m £m £m £m £m
Operating activities
Operating (loss)/profit before tax (2,595) (40,836) 9,832 (1,286) (10,017) 2,372
Operating (loss)/profit before tax on discontinued activities (101) 4,208 68 ———
Adjustments for:
Depreciation and amortisation 2,809 3,154 1,932 ———
Write-down of goodwill and other intangible assets 363 32,581 — ———
Write-down of investment in subsidiaries — ——5,139 14,321 —
Interest on subordinated liabilities 1,490 2,144 1,518 537 499 470
Charge for defined benefit pension schemes 659 490 489 ———
Pension scheme curtailment gains (2,148) —————
Cash contribution to defined benefit pension schemes (1,153) (810) (599) ———
Gain on redemption of own debt (3,790) ——(238) ——
Elimination of non-cash items on discontinued activities — 592 62 ———
Elimination of foreign exchange differences 12,217 (41,874) (10,282) (753) 1,778 (58)
Other non-cash items 7,940 8,772 (3,235) 20 (478) 1
Net cash inflow/(outflow) from trading activities 15,691 (31,579) (215) 3,419 6,103 2,785
Changes in operating assets and liabilities (15,964) (42,219) 28,261 12,537 (22,254) 15,562
Net cash flows from operating activities before tax (273) (73,798) 28,046 15,956 (16,151) 18,347
Income taxes (paid)/received (719) (1,540) (2,442) 409 119 6
Net cash flows from operating activities 33 (992) (75,338) 25,604 16,365 (16,032) 18,353
Investing activities
Sale and maturity of securities 76,492 53,390 63,007 ———
Purchase of securities (73,593) (55,229) (61,020) ———
Investment in subsidiaries — ——(23,902) (10,349) (18,510)
Disposal of subsidiaries — ——7,908 700 6
Sale of property, plant and equipment 1,948 2,228 5,786 ———
Purchase of property, plant and equipment (4,898) (5,757) (5,080) ———
Proceeds on disposal of discontinued activities — 20,113 (334) ———
Net investment in business interests and intangible assets 34 105 2,252 13,640 ———
Repayments from subsidiaries — ——274 — 469
Net cash flows from investing activities 54 16,997 15,999 (15,720) (9,649) (18,035)
Financing activities
Issue of ordinary shares — 49 77 —49 77
Placing and open offer 5,274 19,741 — 5,274 19,741 —
Rights issue — 12,000 — —12,000 —
Issue of B shares 25,101 ——12,801 ——
Issue of other equity interests — — 3,600 —— 3,600
Issue of paid-in equity — — 1,073 —— 1,073
Issue of subordinated liabilities 2,309 2,413 1,018 ———
Proceeds of minority interests issued 9 1,427 31,095 ———
Redemption of paid-in equity (308) ——(308) ——
Redemption of preference shares (5,000) ——(5,000) ——
Redemption of minority interests (422) (13,579) (545) ———
Shares purchased by employee trusts (33) (64) (65) ———
Shares issued under employee share schemes — 279 ———
Repayment of subordinated liabilities (5,145) (1,727) (1,708) (458) — (469)
Dividends paid (1,248) (3,193) (3,411) (935) (2,908) (3,290)
Interest on subordinated liabilities (1,746) (1,967) (1,522) (557) (466) (455)
Net cash flows from financing activities 18,791 15,102 29,691 10,817 28,416 536
Effects of exchange rate changes on cash and cash equivalents (8,592) 29,209 6,010 (83) 761 62
Net increase/(decrease) in cash and cash equivalents 9,261 (14,030) 77,304 11,379 3,496 916
Cash and cash equivalents at 1 January 134,925 148,955 71,651 5,069 1,573 657
Cash and cash equivalents at 31 December 144,186 134,925 148,955 16,448 5,069 1,573
The accompanying notes on pages 259 to 348, the accounting policies on pages 248 to 258 and the audited sections of the Business review: Risk,
capital and liquidity management on pages 117 to 206 form an integral part of these financial statements.