RBS 2009 Annual Report Download - page 354
Download and view the complete annual report
Please find page 354 of the 2009 RBS annual report below. You can navigate through the pages in the report by either clicking on the pages listed below, or by using the keyword search tool below to find specific information within the annual report.-
 1
1 -
2
-
3
-
4
-
5
-
6
-
7
-
8
-
9
-
10
-
11
-
12
-
13
-
14
-
15
-
16
-
17
-
18
-
19
-
20
-
21
-
22
-
23
-
24
-
25
-
26
-
27
-
28
-
29
-
30
-
31
-
32
-
33
-
34
-
35
-
36
-
37
-
38
-
39
-
40
-
41
-
42
-
43
-
44
-
45
-
46
-
47
-
48
-
49
-
50
-
51
-
52
-
53
-
54
-
55
-
56
-
57
-
58
-
59
-
60
-
61
-
62
-
63
-
64
-
65
-
66
-
67
-
68
-
69
-
70
-
71
-
72
-
73
-
74
-
75
-
76
-
77
-
78
-
79
-
80
-
81
-
82
-
83
-
84
-
85
-
86
-
87
-
88
-
89
-
90
-
91
-
92
-
93
-
94
-
95
-
96
-
97
-
98
-
99
-
100
-
101
-
102
-
103
-
104
-
105
-
106
-
107
-
108
-
109
-
110
-
111
-
112
-
113
-
114
-
115
-
116
-
117
-
118
-
119
-
120
-
121
-
122
-
123
-
124
-
125
-
126
-
127
-
128
-
129
-
130
-
131
-
132
-
133
-
134
-
135
-
136
-
137
-
138
-
139
-
140
-
141
-
142
-
143
-
144
-
145
-
146
-
147
-
148
-
149
-
150
-
151
-
152
-
153
-
154
-
155
-
156
-
157
-
158
-
159
-
160
-
161
-
162
-
163
-
164
-
165
-
166
-
167
-
168
-
169
-
170
-
171
-
172
-
173
-
174
-
175
-
176
-
177
-
178
-
179
-
180
-
181
-
182
-
183
-
184
-
185
-
186
-
187
-
188
-
189
-
190
-
191
-
192
-
193
-
194
-
195
-
196
-
197
-
198
-
199
-
200
-
201
-
202
-
203
-
204
-
205
-
206
-
207
-
208
-
209
-
210
-
211
-
212
-
213
-
214
-
215
-
216
-
217
-
218
-
219
-
220
-
221
-
222
-
223
-
224
-
225
-
226
-
227
-
228
-
229
-
230
-
231
-
232
-
233
-
234
-
235
-
236
-
237
-
238
-
239
-
240
-
241
-
242
-
243
-
244
-
245
-
246
-
247
-
248
-
249
-
250
-
251
-
252
-
253
-
254
-
255
-
256
-
257
-
258
-
259
-
260
-
261
-
262
-
263
-
264
-
265
-
266
-
267
-
268
-
269
-
270
-
271
-
272
-
273
-
274
-
275
-
276
-
277
-
278
-
279
-
280
-
281
-
282
-
283
-
284
-
285
-
286
-
287
-
288
-
289
-
290
-
291
-
292
-
293
-
294
-
295
-
296
-
297
-
298
-
299
-
300
-
301
-
302
-
303
-
304
-
305
-
306
-
307
-
308
-
309
-
310
-
311
-
312
-
313
-
314
-
315
-
316
-
317
-
318
-
319
-
320
-
321
-
322
-
323
-
324
-
325
-
326
-
327
-
328
-
329
-
330
-
331
-
332
-
333
-
334
-
335
-
336
-
337
-
338
-
339
-
340
-
341
-
342
-
343
-
 344
344 -
 345
345 -
 346
346 -
 347
347 -
 348
348 -
 349
349 -
 350
350 -
 351
351 -
 352
352 -
 353
353 -
 354
354 -
 355
355 -
 356
356 -
 357
357 -
 358
358 -
 359
359 -
 360
360 -
 361
361 -
 362
362 -
 363
363 -
 364
364 -
365
-
366
-
367
-
368
-
369
-
370
-
371
-
372
-
373
-
374
-
375
-
376
-
377
-
378
-
379
-
380
-
381
-
382
-
383
-
384
-
385
-
386
-
387
-
388
-
389
-
390
 |
 |

Additional information continued
RBS Group Annual Report and Accounts 2009352
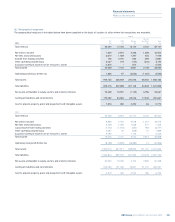
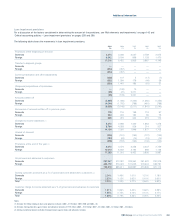
2009 2008 2007
£m £m £m
United States 74,409 91,544 91,653
Germany 41,727 40,812 51,123
France 37,489 58,251 65,430
Spain 27,118 36,441 31,651
Netherlands 20,262 34,283 27,707
Japan 18,939 * 31,922
Republic of Ireland 14,902 18,662 17,736
Italy 14,412 * 23,925
Cayman Islands *18,126 17,099
* Less than 0.75% of Group total assets.
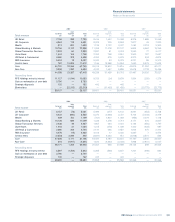
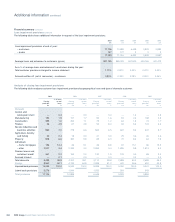
Financial summary continued
Analysis of loans and advances to customers
The following table analyses loans and advances to customers before provisions by remaining maturity, geographical area and type of customer.
After 1
Within but within After 2009
1 year 5 years 5 years Total 2008 2007 2006 2005
£m £m £m £m £m £m £m £m
UK
Central and local government 2,403 27 744 3,174 3,091 3,135 6,732 3,340
Manufacturing 6,215 3,328 1,889 11,432 15,074 13,452 11,051 11,615
Construction 4,603 1,677 1,500 7,780 10,171 10,202 8,251 7,274
Finance 28,094 4,441 3,748 36,283 42,432 70,006 25,017 27,091
Service industries and business activities 18,727 14,384 18,744 51,855 58,638 53,965 43,887 40,687
Agriculture, forestry and fishing 1,233 365 1,315 2,913 2,972 2,473 2,767 2,645
Property 15,557 18,301 15,037 48,895 52,127 50,051 39,296 32,899
Individuals – home mortgages 1,642 3,122 87,819 92,583 80,967 73,916 70,884 65,286
– other 16,917 3,996 4,341 25,254 26,989 28,186 27,922 26,323
Finance leases and instalment credit 3,024 6,012 7,150 16,186 17,363 15,632 14,218 13,909
Accrued interest 922 10 60 992 2,463 2,344 1,497 1,250
Total domestic 99,337 55,663 142,347 297,347 312,287 323,362 251,522 232,319
Overseas residents 32,666 36,049 21,176 89,891 119,656 98,845 69,242 52,234
Total UK offices 132,003 91,712 163,523 387,238 431,943 422,207 320,764 284,553
Overseas
US 31,860 30,043 31,666 93,569 126,277 135,059 92,166 90,606
Rest of the World 81,008 51,875 131,829 264,712 327,391 277,721 57,896 45,951
Total Overseas offices 112,868 81,918 163,495 358,281 453,668 412,780 150,062 136,557
Loans and advances to customers – gross 244,871 173,630 327,018 745,519 885,611 834,987 470,826 421,110
Loan impairment provisions (17,126) (10,889) (6,449) (3,933) (3,884)
Loans and advances to customers – net 728,393 874,722 828,538 466,893 417,226
Fixed rate 53,294 40,920 144,542 238,756 183,693 351,336 115,240 100,748
Variable rate 191,577 132,710 182,476 506,763 701,918 483,651 355,586 320,362
Loans and advances to customers – gross 244,871 173,630 327,018 745,519 885,611 834,987 470,826 421,110
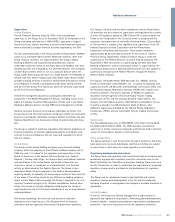
Cross border exposures
Cross border exposures are defined as loans to banks and customers
(including finance lease and instalment credit receivables) and other
monetary assets, including non-local currency claims of overseas
offices on local residents.
The Group monitors the geographical breakdown of these exposures
based on the country of domicile of the borrower or guarantor of
ultimate risk.
The table below sets out the Group’s cross border outstandings in
excess of 0.75% of Group total assets (including acceptances), which
totalled £1,696.5 billion at 31 December 2009 (2008 – £2,401.7 billion;
2007 – £1,840.8 billion). None of these countries has experienced
repayment difficulties that have required restructuring of outstanding
debt.