RBS 2009 Annual Report Download - page 79
Download and view the complete annual report
Please find page 79 of the 2009 RBS annual report below. You can navigate through the pages in the report by either clicking on the pages listed below, or by using the keyword search tool below to find specific information within the annual report.-
 1
1 -
2
-
3
-
4
-
5
-
6
-
7
-
8
-
9
-
10
-
11
-
12
-
13
-
14
-
15
-
16
-
17
-
18
-
19
-
20
-
21
-
22
-
23
-
24
-
25
-
26
-
27
-
28
-
29
-
30
-
31
-
32
-
33
-
34
-
35
-
36
-
37
-
38
-
39
-
40
-
41
-
42
-
43
-
44
-
45
-
46
-
47
-
48
-
49
-
50
-
51
-
52
-
53
-
54
-
55
-
56
-
57
-
58
-
59
-
60
-
61
-
62
-
63
-
64
-
65
-
66
-
67
-
68
-
 69
69 -
 70
70 -
 71
71 -
 72
72 -
 73
73 -
 74
74 -
 75
75 -
 76
76 -
 77
77 -
 78
78 -
 79
79 -
 80
80 -
 81
81 -
 82
82 -
 83
83 -
 84
84 -
 85
85 -
 86
86 -
 87
87 -
 88
88 -
 89
89 -
90
-
91
-
92
-
93
-
94
-
95
-
96
-
97
-
98
-
99
-
100
-
101
-
102
-
103
-
104
-
105
-
106
-
107
-
108
-
109
-
110
-
111
-
112
-
113
-
114
-
115
-
116
-
117
-
118
-
119
-
120
-
121
-
122
-
123
-
124
-
125
-
126
-
127
-
128
-
129
-
130
-
131
-
132
-
133
-
134
-
135
-
136
-
137
-
138
-
139
-
140
-
141
-
142
-
143
-
144
-
145
-
146
-
147
-
148
-
149
-
150
-
151
-
152
-
153
-
154
-
155
-
156
-
157
-
158
-
159
-
160
-
161
-
162
-
163
-
164
-
165
-
166
-
167
-
168
-
169
-
170
-
171
-
172
-
173
-
174
-
175
-
176
-
177
-
178
-
179
-
180
-
181
-
182
-
183
-
184
-
185
-
186
-
187
-
188
-
189
-
190
-
191
-
192
-
193
-
194
-
195
-
196
-
197
-
198
-
199
-
200
-
201
-
202
-
203
-
204
-
205
-
206
-
207
-
208
-
209
-
210
-
211
-
212
-
213
-
214
-
215
-
216
-
217
-
218
-
219
-
220
-
221
-
222
-
223
-
224
-
225
-
226
-
227
-
228
-
229
-
230
-
231
-
232
-
233
-
234
-
235
-
236
-
237
-
238
-
239
-
240
-
241
-
242
-
243
-
244
-
245
-
246
-
247
-
248
-
249
-
250
-
251
-
252
-
253
-
254
-
255
-
256
-
257
-
258
-
259
-
260
-
261
-
262
-
263
-
264
-
265
-
266
-
267
-
268
-
269
-
270
-
271
-
272
-
273
-
274
-
275
-
276
-
277
-
278
-
279
-
280
-
281
-
282
-
283
-
284
-
285
-
286
-
287
-
288
-
289
-
290
-
291
-
292
-
293
-
294
-
295
-
296
-
297
-
298
-
299
-
300
-
301
-
302
-
303
-
304
-
305
-
306
-
307
-
308
-
309
-
310
-
311
-
312
-
313
-
314
-
315
-
316
-
317
-
318
-
319
-
320
-
321
-
322
-
323
-
324
-
325
-
326
-
327
-
328
-
329
-
330
-
331
-
332
-
333
-
334
-
335
-
336
-
337
-
338
-
339
-
340
-
341
-
342
-
343
-
344
-
345
-
346
-
347
-
348
-
349
-
350
-
351
-
352
-
353
-
354
-
355
-
356
-
357
-
358
-
359
-
360
-
361
-
362
-
363
-
364
-
365
-
366
-
367
-
368
-
369
-
370
-
371
-
372
-
373
-
374
-
375
-
376
-
377
-
378
-
379
-
380
-
381
-
382
-
383
-
384
-
385
-
386
-
387
-
388
-
389
-
390
 |
 |

77RBS Group Annual Report and Accounts 2009
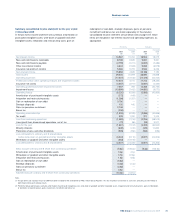
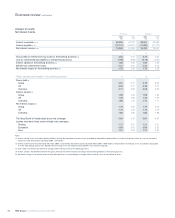
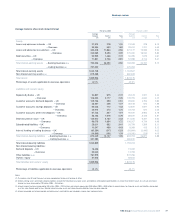
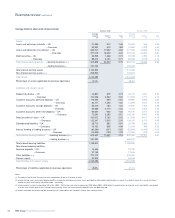
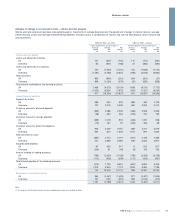
Average balance sheet and related interest Pro forma 2009 Pro forma 2008
Average Average
balance Interest Rate balance Interest Rate
£m £m % £m £m %
Assets
Loans and advances to banks – UK 21,373 278 1.30 19,049 978 5.13
– Overseas 30,384 553 1.82 28,474 1,311 4.60
Loans and advances to customers – UK 333,408 11,864 3.56 321,177 19,085 5.94
– Overseas 242,065 9,493 3.92 275,000 16,030 5.83
Debt securities – UK 53,955 1,466 2.72 36,395 1,679 4.61
– Overseas 71,851 2,736 3.81 57,998 3,114 5.37
Total interest-earning assets – banking business (2, 3) 753,036 26,390 3.50 738,093 42,197 5.72
– trading business (4) 291,092 425,454
Total interest-earning assets 1,044,128 1,163,547
Non-interest-earning assets (2, 3) 815,468 660,628
Total assets 1,859,596 1,824,175
Percentage of assets applicable to overseas operations 42.0% 42.5%
Liabilities and owners’ equity
Deposits by banks – UK 24,837 675 2.72 45,123 1,507 3.34
– Overseas 106,353 2,177 2.05 109,705 4,630 4.22
Customer accounts: demand deposits – UK 109,756 559 0.51 99,840 2,794 2.80
– Overseas 38,287 408 1.07 36,108 672 1.86
Customer accounts: savings deposits – UK 54,048 772 1.43 42,870 1,691 3.94
– Overseas 26,976 473 1.75 23,753 570 2.40
Customer accounts: other time deposits – UK 67,728 807 1.19 95,181 3,964 4.16
– Overseas 58,168 1,618 2.78 88,570 3,426 3.87
Debt securities in issue – UK 130,002 3,162 2.43 114,234 5,281 4.62
– Overseas 96,075 1,654 1.72 106,207 4,734 4.46
Subordinated liabilities – UK 25,001 852 3.41 26,799 1,369 5.11
– Overseas 10,347 458 4.43 8,068 413 5.12
Internal funding of trading business – UK (60,284) (317) 0.53 (85,664) (3,445) 4.02
– Overseas (14,845) (191) 1.29 (18,090) (729) 4.03
Total interest-bearing liabilities – banking business (2, 3) 672,449 13,107 1.95 692,704 26,877 3.88
– trading business (4) 331,380 466,610
Total interest-bearing liabilities 1,003,829 1,159,314
Non-interest-bearing liabilities:
Demand deposits – UK 16,446 19,262
– Overseas 20,043 14,759
Other liabilities (3, 4) 761,975 572,296
Owners’ equity 57,303 58,544
Total liabilities and owners’ equity 1,859,596 1,824,175
Percentage of liabilities applicable to overseas operations 41.2% 43.1%
Notes:
(1) The analysis into UK and Overseas has been compiled on the basis of location of office.
(2) Interest-earning assets and interest-bearing liabilities exclude the Retail bancassurance assets and liabilities attributable to policyholders, in view of their distinct nature. As a result, net interest
income has been increased by £20 million (2008 – £84 million).
(3) Interest income has been increased by £46 million (2008 – £332 million) and interest expense by £350 million (2008 – £860 million) to record interest on financial assets and liabilities designated
as at fair value through profit or loss. Related interest-earning assets and interest-bearing liabilities have also been adjusted.
(4) Interest receivable and interest payable on trading assets and liabilities are included in income from trading activities.
Business review