RBS 2009 Annual Report Download - page 191
Download and view the complete annual report
Please find page 191 of the 2009 RBS annual report below. You can navigate through the pages in the report by either clicking on the pages listed below, or by using the keyword search tool below to find specific information within the annual report.-
 1
1 -
2
-
3
-
4
-
5
-
6
-
7
-
8
-
9
-
10
-
11
-
12
-
13
-
14
-
15
-
16
-
17
-
18
-
19
-
20
-
21
-
22
-
23
-
24
-
25
-
26
-
27
-
28
-
29
-
30
-
31
-
32
-
33
-
34
-
35
-
36
-
37
-
38
-
39
-
40
-
41
-
42
-
43
-
44
-
45
-
46
-
47
-
48
-
49
-
50
-
51
-
52
-
53
-
54
-
55
-
56
-
57
-
58
-
59
-
60
-
61
-
62
-
63
-
64
-
65
-
66
-
67
-
68
-
69
-
70
-
71
-
72
-
73
-
74
-
75
-
76
-
77
-
78
-
79
-
80
-
81
-
82
-
83
-
84
-
85
-
86
-
87
-
88
-
89
-
90
-
91
-
92
-
93
-
94
-
95
-
96
-
97
-
98
-
99
-
100
-
101
-
102
-
103
-
104
-
105
-
106
-
107
-
108
-
109
-
110
-
111
-
112
-
113
-
114
-
115
-
116
-
117
-
118
-
119
-
120
-
121
-
122
-
123
-
124
-
125
-
126
-
127
-
128
-
129
-
130
-
131
-
132
-
133
-
134
-
135
-
136
-
137
-
138
-
139
-
140
-
141
-
142
-
143
-
144
-
145
-
146
-
147
-
148
-
149
-
150
-
151
-
152
-
153
-
154
-
155
-
156
-
157
-
158
-
159
-
160
-
161
-
162
-
163
-
164
-
165
-
166
-
167
-
168
-
169
-
170
-
171
-
172
-
173
-
174
-
175
-
176
-
177
-
178
-
179
-
180
-
 181
181 -
 182
182 -
 183
183 -
 184
184 -
 185
185 -
 186
186 -
 187
187 -
 188
188 -
 189
189 -
 190
190 -
 191
191 -
 192
192 -
 193
193 -
 194
194 -
 195
195 -
 196
196 -
 197
197 -
 198
198 -
 199
199 -
 200
200 -
 201
201 -
202
-
203
-
204
-
205
-
206
-
207
-
208
-
209
-
210
-
211
-
212
-
213
-
214
-
215
-
216
-
217
-
218
-
219
-
220
-
221
-
222
-
223
-
224
-
225
-
226
-
227
-
228
-
229
-
230
-
231
-
232
-
233
-
234
-
235
-
236
-
237
-
238
-
239
-
240
-
241
-
242
-
243
-
244
-
245
-
246
-
247
-
248
-
249
-
250
-
251
-
252
-
253
-
254
-
255
-
256
-
257
-
258
-
259
-
260
-
261
-
262
-
263
-
264
-
265
-
266
-
267
-
268
-
269
-
270
-
271
-
272
-
273
-
274
-
275
-
276
-
277
-
278
-
279
-
280
-
281
-
282
-
283
-
284
-
285
-
286
-
287
-
288
-
289
-
290
-
291
-
292
-
293
-
294
-
295
-
296
-
297
-
298
-
299
-
300
-
301
-
302
-
303
-
304
-
305
-
306
-
307
-
308
-
309
-
310
-
311
-
312
-
313
-
314
-
315
-
316
-
317
-
318
-
319
-
320
-
321
-
322
-
323
-
324
-
325
-
326
-
327
-
328
-
329
-
330
-
331
-
332
-
333
-
334
-
335
-
336
-
337
-
338
-
339
-
340
-
341
-
342
-
343
-
344
-
345
-
346
-
347
-
348
-
349
-
350
-
351
-
352
-
353
-
354
-
355
-
356
-
357
-
358
-
359
-
360
-
361
-
362
-
363
-
364
-
365
-
366
-
367
-
368
-
369
-
370
-
371
-
372
-
373
-
374
-
375
-
376
-
377
-
378
-
379
-
380
-
381
-
382
-
383
-
384
-
385
-
386
-
387
-
388
-
389
-
390
 |
 |

Business review
Risk, capital and liquidity management
189RBS Group Annual Report and Accounts 2009
Key points
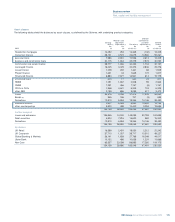
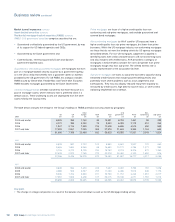
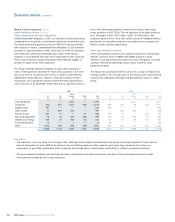
•Total asset-backed securities decreased from £111.1 billion at 31
December 2008 to £88.2 billion at 31 December 2009, due principally
to exchange rate movements and the significant sell-down activity
which took place in the first half of the year. In addition, credit
spreads widened in the first half of the year, further reducing carrying
values, although this was off-set to some extent by spreads tightening
in the second half of the year. Sales have been limited in the second
half of the year, however maturities have continued to reduce the
balance sheet exposures.
•Life-to-date net valuation losses on ABS held at 31 December 2009,
including impairment provisions, were £20.1 billion comprising:
– RMBS: £3.6 billion, of which £0.7 billion was in US sub-prime and
£2.3 billion in European assets;
– CMBS: £1.2 billion;
– CDOs: £9.4 billion and CLOs: £3.3 billion, significantly all in Non-
Core; and
– Other ABS: £2.6 billion.
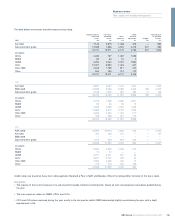
•The majority of the Group’s exposure to ABS is through government-
backed RMBS, amounting to £43.6 billion at 31 December 2009 (2008
– £51.6 billion), and includes:
– US government -backed securities, comprising mainly current year
vintage positions, were £27.0 billion (2008 – £33.5 billion). Due to
the US government backing, explicit or implicit, for these securities,
the counterparty credit risk exposure is low. This is comprised of:
– HFT securities of £13.4 billion (2008 – £18.6 billion). These
securities are actively transacted and possess a high degree of
liquidity. Trading in this portfolio has shifted to more recent
vintages;
– AFS securities of £13.6 billion (2008 – £14.9 billion) relating to
liquidity portfolios held by US Retail & Commercial; and
– The decrease in exposure over the year was due to foreign
exchange movements driven by the strengthening of sterling
against the US dollar in the first half of the year and a decrease
in the balances in the second half of the year.
– Other European government-backed exposures of £16.2 billion. This
largely comprises liquidity portfolios of £15.6 billion held by Group
Treasury (2008 – £17.7 billion) in European government-backed
RMBS, referencing primarily Dutch and Spanish government-backed
loans and covered mortgage bonds. The portfolio reduced during
the year, driven primarily by exchange rate movements, partially off-
set by improved prices, mainly during the second half of the year.
•The Group has other portfolios of RMBS from secondary trading
activities, warehoused positions previously acquired with the intention
of securitisation, and a portfolio of assets from the unwinding of the
Group’s securities arbitrage conduit in 2008.
•Material disposals of prime RMBS occurred in the first half of the
year, in particular £1.5 billion of 2005 vintage US securities, £0.5
billion of Spanish and Portuguese mortgages and £0.6 billion of
positions which were hedged.
•CDOs decreased from £9.0 billion at 31 December 2008 to £3.9
billion at 31 December 2009, driven primarily by significant declines in
prices, together with foreign exchange movements, in the first half of
the year.
•Subprime balances decreased across ratings, geographies and
vintages, due to pay-downs, maturities and sales during the year,
while non-conforming exposures fell mainly due to UK AAA-rated AFS
redemptions. During the third quarter, improved prices off-set the
effect of redemptions in some portfolios.
•US Mortgage trading in GBM, US Retail and Commercial are in Core.
•Many of the assets, primarily CDOs and CLOs, in Non-Core Trading
have market hedges in place which gives rise to a significant
difference between the carrying value and the net exposure.
•AAA-rated assets decreased from £93.9 billion at 31 December 2008
to £65.6 billion at 31 December 2009 primarily as a result of the sell-
down activity of prime and government-backed securities.
•There was no significant change in the percentage of asset-backed
securities classified as level 2 and level 3 assets year-on-year (2009 –
87% and 4% respectively, 2008 – 87% and 5% respectively).
•There were significant downgrades of AAA-rated CLOs to BBB during
the year.
The remainder of this section provides additional information and
analysis of specific ABS portfolios.
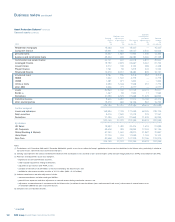
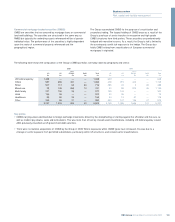
Residential mortgage-backed securities (RMBS)
RMBS are securities that represent an interest in a portfolio of
residential mortgages. Repayments made on the underlying mortgages
are used to make payments to holders of the RMBS. The risk of the
RMBS will vary primarily depending on the quality and geographic
region of the underlying mortgage assets and the credit enhancement
of the securitisation structure. Several tranches of notes are issued,
each secured against the same portfolio of mortgages, but providing
differing levels of seniority to match the risk appetite of investors. The
most junior (or equity) notes will suffer early capital and interest losses
experienced by the referenced mortgage collateral, with each more
senior note benefiting from the protection provided by the subordinated
notes below. Additional credit enhancements may be provided to the
holder of senior RMBS notes, including guarantees over the value of the
exposures, often provided by monoline insurers.
The main categories of mortgages that serve as collateral to RMBS held
by the Group are described below. The US market has more established
definitions of differing underlying mortgage quality and these are used
as the basis for the Group’s RMBS categorisation.