RBS 2009 Annual Report Download - page 159
Download and view the complete annual report
Please find page 159 of the 2009 RBS annual report below. You can navigate through the pages in the report by either clicking on the pages listed below, or by using the keyword search tool below to find specific information within the annual report.-
 1
1 -
2
-
3
-
4
-
5
-
6
-
7
-
8
-
9
-
10
-
11
-
12
-
13
-
14
-
15
-
16
-
17
-
18
-
19
-
20
-
21
-
22
-
23
-
24
-
25
-
26
-
27
-
28
-
29
-
30
-
31
-
32
-
33
-
34
-
35
-
36
-
37
-
38
-
39
-
40
-
41
-
42
-
43
-
44
-
45
-
46
-
47
-
48
-
49
-
50
-
51
-
52
-
53
-
54
-
55
-
56
-
57
-
58
-
59
-
60
-
61
-
62
-
63
-
64
-
65
-
66
-
67
-
68
-
69
-
70
-
71
-
72
-
73
-
74
-
75
-
76
-
77
-
78
-
79
-
80
-
81
-
82
-
83
-
84
-
85
-
86
-
87
-
88
-
89
-
90
-
91
-
92
-
93
-
94
-
95
-
96
-
97
-
98
-
99
-
100
-
101
-
102
-
103
-
104
-
105
-
106
-
107
-
108
-
109
-
110
-
111
-
112
-
113
-
114
-
115
-
116
-
117
-
118
-
119
-
120
-
121
-
122
-
123
-
124
-
125
-
126
-
127
-
128
-
129
-
130
-
131
-
132
-
133
-
134
-
135
-
136
-
137
-
138
-
139
-
140
-
141
-
142
-
143
-
144
-
145
-
146
-
147
-
148
-
 149
149 -
 150
150 -
 151
151 -
 152
152 -
 153
153 -
 154
154 -
 155
155 -
 156
156 -
 157
157 -
 158
158 -
 159
159 -
 160
160 -
 161
161 -
 162
162 -
 163
163 -
 164
164 -
 165
165 -
 166
166 -
 167
167 -
 168
168 -
 169
169 -
170
-
171
-
172
-
173
-
174
-
175
-
176
-
177
-
178
-
179
-
180
-
181
-
182
-
183
-
184
-
185
-
186
-
187
-
188
-
189
-
190
-
191
-
192
-
193
-
194
-
195
-
196
-
197
-
198
-
199
-
200
-
201
-
202
-
203
-
204
-
205
-
206
-
207
-
208
-
209
-
210
-
211
-
212
-
213
-
214
-
215
-
216
-
217
-
218
-
219
-
220
-
221
-
222
-
223
-
224
-
225
-
226
-
227
-
228
-
229
-
230
-
231
-
232
-
233
-
234
-
235
-
236
-
237
-
238
-
239
-
240
-
241
-
242
-
243
-
244
-
245
-
246
-
247
-
248
-
249
-
250
-
251
-
252
-
253
-
254
-
255
-
256
-
257
-
258
-
259
-
260
-
261
-
262
-
263
-
264
-
265
-
266
-
267
-
268
-
269
-
270
-
271
-
272
-
273
-
274
-
275
-
276
-
277
-
278
-
279
-
280
-
281
-
282
-
283
-
284
-
285
-
286
-
287
-
288
-
289
-
290
-
291
-
292
-
293
-
294
-
295
-
296
-
297
-
298
-
299
-
300
-
301
-
302
-
303
-
304
-
305
-
306
-
307
-
308
-
309
-
310
-
311
-
312
-
313
-
314
-
315
-
316
-
317
-
318
-
319
-
320
-
321
-
322
-
323
-
324
-
325
-
326
-
327
-
328
-
329
-
330
-
331
-
332
-
333
-
334
-
335
-
336
-
337
-
338
-
339
-
340
-
341
-
342
-
343
-
344
-
345
-
346
-
347
-
348
-
349
-
350
-
351
-
352
-
353
-
354
-
355
-
356
-
357
-
358
-
359
-
360
-
361
-
362
-
363
-
364
-
365
-
366
-
367
-
368
-
369
-
370
-
371
-
372
-
373
-
374
-
375
-
376
-
377
-
378
-
379
-
380
-
381
-
382
-
383
-
384
-
385
-
386
-
387
-
388
-
389
-
390
 |
 |

Business review
Risk, capital and liquidity management
157RBS Group Annual Report and Accounts 2009
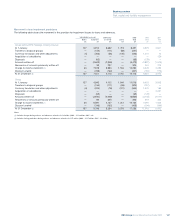
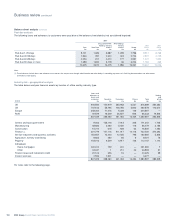
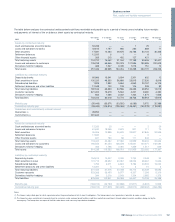
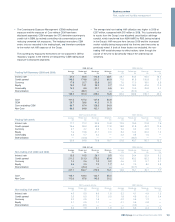
The table below analyses the contractual undiscounted cash flows receivable and payable up to a period of twenty years including future receipts
and payments of interest of the on balance sheet assets by contractual maturity.
0-3 months 3-12 months 1-3 years 3-5 years 5-10 years 10-20 years
2009 £m £m £m £m £m £m
Assets by contractual maturity
Cash and balances at central banks 52,239 — — 1 25 —
Loans and advances to banks 42,615 1,757 966 282 868 71
Debt securities 17,581 14,484 29,675 26,788 52,104 30,335
Settlement balances 12,020 6 1 — 8 1
Other financial assets 265 215 402 127 421 —
Total maturing assets 124,720 16,462 31,044 27,198 53,426 30,407
Loans and advances to customers 126,238 65,946 130,323 101,984 180,595 202,809
Derivatives held for hedging 488 1,547 3,049 1,076 751 10
Total assets 251,446 83,955 164,416 130,258 234,772 233,226
Liabilities by contractual maturity
Deposits by banks 65,966 15,541 3,934 2,301 632 12
Debt
securities
in issue 100,220 49,300 56,869 25,915 27,326 3,819
Subordinated liabilities 1,929 1,892 3,654 4,963 20,157 6,105
Settlement balances and other liabilities 12,048 100 139 104 239 83
Total maturing liabilities 180,163 66,833 64,596 33,283 48,354 10,019
Customer accounts 521,400 15,619 5,944 4,221 8,490 4,392
Derivatives held for hedging 660 1,566 3,232 1,264 1,674 1,508
Total liabilities 702,223 84,018 73,772 38,768 58,518 15,919
Maturity gap (55,443) (50,371) (33,552) (6,085) 5,072 20,388
Cumulative maturity gap (55,443) (105,814) (139,366) (145,451) (140,379) (119,991)
Guarantees and commitments notional amount
Guarantees (1) 39,952 — — — — —
Commitments (2) 291,634 — — — — —
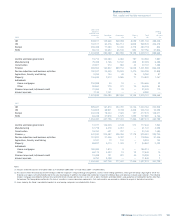
2008
Assets by contractual maturity
Cash and balances at central banks 12,333 25 — — 2 29
Loans and advances to banks 61,630 19,369 2,673 921 111 70
Debt securities 26,006 12,895 24,629 23,927 57,846 24,535
Settlement balances 17,830 — — — 2 —
Other financial assets 621 193 58 111 343 —
Total maturing assets 118,420 32,482 27,360 24,959 58,304 24,634
Loans and advances to customers 195,553 81,054 138,378 125,621 160,271 152,084
Derivatives held for hedging 266 1,796 2,281 1,359 1,517 649
Total assets 314,239 115,332 168,019 151,939 220,092 177,367
Liabilities by contractual maturity
Deposits by banks 154,614 14,347 3,345 2,754 2,048 34
Debt securities in issue 131,714 48,652 40,067 38,223 38,667 5,626
Subordinated liabilities 1,753 4,271 6,824 5,793 24,503 13,030
Settlement balances and other liabilities 13,351 5 12 6 10 6
Total maturing liabilities 301,432 67,275 50,248 46,776 65,228 18,696
Customer accounts 523,268 33,450 6,577 6,337 7,298 5,319
Derivatives held for hedging 394 2,216 2,543 1,334 2,682 1,373
Total liabilities 825,094 102,941 59,368 54,447 75,208 25,388
Maturity gap (183,012) (34,793) (22,888) (21,817) (6,924) 5,938
Cumulative maturity gap (183,012) (217,805) (240,693) (262,510) (269,434) (263,496)
Notes:
(1) The Group is only called upon to satisfy a guarantee when the guaranteed party fails to meet its obligations. The Group expects most guarantees it provides to expire unused.
(2) The Group has given commitments to provide funds to customers under undrawn formal facilities, credit lines and other commitments to lend subject to certain conditions being met by the
counterparty. The Group does not expect all facilities to be drawn, and some may lapse before drawdown.