RBS 2009 Annual Report Download - page 186
Download and view the complete annual report
Please find page 186 of the 2009 RBS annual report below. You can navigate through the pages in the report by either clicking on the pages listed below, or by using the keyword search tool below to find specific information within the annual report.-
 1
1 -
2
-
3
-
4
-
5
-
6
-
7
-
8
-
9
-
10
-
11
-
12
-
13
-
14
-
15
-
16
-
17
-
18
-
19
-
20
-
21
-
22
-
23
-
24
-
25
-
26
-
27
-
28
-
29
-
30
-
31
-
32
-
33
-
34
-
35
-
36
-
37
-
38
-
39
-
40
-
41
-
42
-
43
-
44
-
45
-
46
-
47
-
48
-
49
-
50
-
51
-
52
-
53
-
54
-
55
-
56
-
57
-
58
-
59
-
60
-
61
-
62
-
63
-
64
-
65
-
66
-
67
-
68
-
69
-
70
-
71
-
72
-
73
-
74
-
75
-
76
-
77
-
78
-
79
-
80
-
81
-
82
-
83
-
84
-
85
-
86
-
87
-
88
-
89
-
90
-
91
-
92
-
93
-
94
-
95
-
96
-
97
-
98
-
99
-
100
-
101
-
102
-
103
-
104
-
105
-
106
-
107
-
108
-
109
-
110
-
111
-
112
-
113
-
114
-
115
-
116
-
117
-
118
-
119
-
120
-
121
-
122
-
123
-
124
-
125
-
126
-
127
-
128
-
129
-
130
-
131
-
132
-
133
-
134
-
135
-
136
-
137
-
138
-
139
-
140
-
141
-
142
-
143
-
144
-
145
-
146
-
147
-
148
-
149
-
150
-
151
-
152
-
153
-
154
-
155
-
156
-
157
-
158
-
159
-
160
-
161
-
162
-
163
-
164
-
165
-
166
-
167
-
168
-
169
-
170
-
171
-
172
-
173
-
174
-
175
-
 176
176 -
 177
177 -
 178
178 -
 179
179 -
 180
180 -
 181
181 -
 182
182 -
 183
183 -
 184
184 -
 185
185 -
 186
186 -
 187
187 -
 188
188 -
 189
189 -
 190
190 -
 191
191 -
 192
192 -
 193
193 -
 194
194 -
 195
195 -
 196
196 -
197
-
198
-
199
-
200
-
201
-
202
-
203
-
204
-
205
-
206
-
207
-
208
-
209
-
210
-
211
-
212
-
213
-
214
-
215
-
216
-
217
-
218
-
219
-
220
-
221
-
222
-
223
-
224
-
225
-
226
-
227
-
228
-
229
-
230
-
231
-
232
-
233
-
234
-
235
-
236
-
237
-
238
-
239
-
240
-
241
-
242
-
243
-
244
-
245
-
246
-
247
-
248
-
249
-
250
-
251
-
252
-
253
-
254
-
255
-
256
-
257
-
258
-
259
-
260
-
261
-
262
-
263
-
264
-
265
-
266
-
267
-
268
-
269
-
270
-
271
-
272
-
273
-
274
-
275
-
276
-
277
-
278
-
279
-
280
-
281
-
282
-
283
-
284
-
285
-
286
-
287
-
288
-
289
-
290
-
291
-
292
-
293
-
294
-
295
-
296
-
297
-
298
-
299
-
300
-
301
-
302
-
303
-
304
-
305
-
306
-
307
-
308
-
309
-
310
-
311
-
312
-
313
-
314
-
315
-
316
-
317
-
318
-
319
-
320
-
321
-
322
-
323
-
324
-
325
-
326
-
327
-
328
-
329
-
330
-
331
-
332
-
333
-
334
-
335
-
336
-
337
-
338
-
339
-
340
-
341
-
342
-
343
-
344
-
345
-
346
-
347
-
348
-
349
-
350
-
351
-
352
-
353
-
354
-
355
-
356
-
357
-
358
-
359
-
360
-
361
-
362
-
363
-
364
-
365
-
366
-
367
-
368
-
369
-
370
-
371
-
372
-
373
-
374
-
375
-
376
-
377
-
378
-
379
-
380
-
381
-
382
-
383
-
384
-
385
-
386
-
387
-
388
-
389
-
390
 |
 |

Business review continued
RBS Group Annual Report and Accounts 2009184
Market turmoil exposures
All the disclosures in this section (pages 184 to 206) are audited unless
otherwise indicated with an asterisk (*).
Explanatory note
These disclosures provide information on certain elements of the
Group’s business activities affected by the unprecedented market
events of the second half of 2007 and through 2008 and 2009, the
majority of which reside within Non-Core and, to a lesser extent, Global
Banking & Markets (‘GBM’), US Retail & Commercial and Group
Treasury. For certain disclosures the information presented has been
analysed into the Group’s Core and Non-Core businesses.
Definitions of acronyms used in this section are explained in the
Glossary of terms on page 383 to 387.
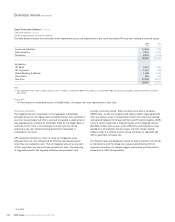
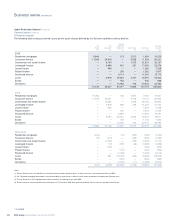
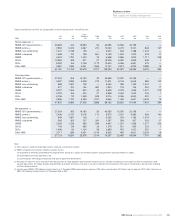
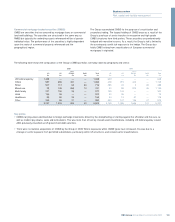
Asset-backed securities
The Group structures, originates, distributes and trades debt in the form
of loan, bond and derivative instruments in all major currencies and
debt capital markets in North America, Western Europe, Asia and major
emerging markets. The carrying value of the Group’s debt securities at
31 December 2009 was £249.1 billion (2008 – £253.2 billion). This
comprised:
2009 2008 2007
Group Group
before RFS before RFS
Holdings Holdings
minority minority
interest Group interest Group Group
£bn £bn £bn £bn £bn
Securities issued by central and local governments 134.1 146.9 95.1 105.8 122.8
Asset-backed securities 87.6 88.1 111.1 111.1 100.1
Securities issued by corporates, US federal agencies and other entities 13.4 14.4 24.3 26.2 43.5
Securities issued by banks and building societies 14.0 17.8 22.7 24.4 28.2
Total debt securities 249.1 267.2 253.2 267.5 294.6
This section focuses on asset-backed securities, an area of interest
following the market dislocations in 2007 and 2008. Asset-backed
securities (ABS) are securities with an interest in an underlying pool of
referenced assets. The risks and rewards of the referenced pool are
passed onto investors by the issue of securities with varying seniority,
by a special purpose entity.
The Group has exposures to ABS which are predominantly debt
securities but can also be held in derivative form. These positions had
been acquired primarily through the Group’s activities in the US
leveraged finance market which expanded during 2007. These include
residential mortgage backed securities (RMBS), commercial mortgage
backed securities (CMBS), ABS collateralised debt obligations (CDOs)
and collateralised loan obligations (CLOs) and other ABS. In many
cases the risk on these assets is hedged by way of credit derivative
protection purchased over the specific asset or relevant ABS indices.
The counterparty to some of these hedge transactions are monoline
insurers (see monoline insurers on page 194).
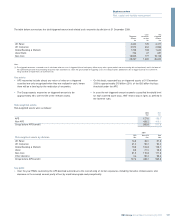
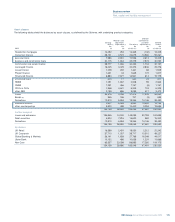
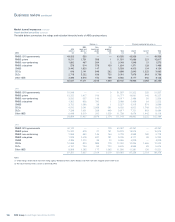
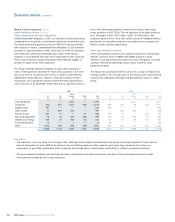
The following table summarises the gross and net exposures and
carrying values of these securities by geography – US, UK, other
Europe and rest of the world (RoW) and by the measurement
classification – held-for-trading (HFT), available-for-sale (AFS), loans and
receivables (LAR) and designated at fair value through profit or loss
(DFV) – of the underlying assets at 31 December 2009.