RBS 2009 Annual Report Download - page 77
Download and view the complete annual report
Please find page 77 of the 2009 RBS annual report below. You can navigate through the pages in the report by either clicking on the pages listed below, or by using the keyword search tool below to find specific information within the annual report.-
 1
1 -
2
-
3
-
4
-
5
-
6
-
7
-
8
-
9
-
10
-
11
-
12
-
13
-
14
-
15
-
16
-
17
-
18
-
19
-
20
-
21
-
22
-
23
-
24
-
25
-
26
-
27
-
28
-
29
-
30
-
31
-
32
-
33
-
34
-
35
-
36
-
37
-
38
-
39
-
40
-
41
-
42
-
43
-
44
-
45
-
46
-
47
-
48
-
49
-
50
-
51
-
52
-
53
-
54
-
55
-
56
-
57
-
58
-
59
-
60
-
61
-
62
-
63
-
64
-
65
-
66
-
 67
67 -
 68
68 -
 69
69 -
 70
70 -
 71
71 -
 72
72 -
 73
73 -
 74
74 -
 75
75 -
 76
76 -
 77
77 -
 78
78 -
 79
79 -
 80
80 -
 81
81 -
 82
82 -
 83
83 -
 84
84 -
 85
85 -
 86
86 -
 87
87 -
88
-
89
-
90
-
91
-
92
-
93
-
94
-
95
-
96
-
97
-
98
-
99
-
100
-
101
-
102
-
103
-
104
-
105
-
106
-
107
-
108
-
109
-
110
-
111
-
112
-
113
-
114
-
115
-
116
-
117
-
118
-
119
-
120
-
121
-
122
-
123
-
124
-
125
-
126
-
127
-
128
-
129
-
130
-
131
-
132
-
133
-
134
-
135
-
136
-
137
-
138
-
139
-
140
-
141
-
142
-
143
-
144
-
145
-
146
-
147
-
148
-
149
-
150
-
151
-
152
-
153
-
154
-
155
-
156
-
157
-
158
-
159
-
160
-
161
-
162
-
163
-
164
-
165
-
166
-
167
-
168
-
169
-
170
-
171
-
172
-
173
-
174
-
175
-
176
-
177
-
178
-
179
-
180
-
181
-
182
-
183
-
184
-
185
-
186
-
187
-
188
-
189
-
190
-
191
-
192
-
193
-
194
-
195
-
196
-
197
-
198
-
199
-
200
-
201
-
202
-
203
-
204
-
205
-
206
-
207
-
208
-
209
-
210
-
211
-
212
-
213
-
214
-
215
-
216
-
217
-
218
-
219
-
220
-
221
-
222
-
223
-
224
-
225
-
226
-
227
-
228
-
229
-
230
-
231
-
232
-
233
-
234
-
235
-
236
-
237
-
238
-
239
-
240
-
241
-
242
-
243
-
244
-
245
-
246
-
247
-
248
-
249
-
250
-
251
-
252
-
253
-
254
-
255
-
256
-
257
-
258
-
259
-
260
-
261
-
262
-
263
-
264
-
265
-
266
-
267
-
268
-
269
-
270
-
271
-
272
-
273
-
274
-
275
-
276
-
277
-
278
-
279
-
280
-
281
-
282
-
283
-
284
-
285
-
286
-
287
-
288
-
289
-
290
-
291
-
292
-
293
-
294
-
295
-
296
-
297
-
298
-
299
-
300
-
301
-
302
-
303
-
304
-
305
-
306
-
307
-
308
-
309
-
310
-
311
-
312
-
313
-
314
-
315
-
316
-
317
-
318
-
319
-
320
-
321
-
322
-
323
-
324
-
325
-
326
-
327
-
328
-
329
-
330
-
331
-
332
-
333
-
334
-
335
-
336
-
337
-
338
-
339
-
340
-
341
-
342
-
343
-
344
-
345
-
346
-
347
-
348
-
349
-
350
-
351
-
352
-
353
-
354
-
355
-
356
-
357
-
358
-
359
-
360
-
361
-
362
-
363
-
364
-
365
-
366
-
367
-
368
-
369
-
370
-
371
-
372
-
373
-
374
-
375
-
376
-
377
-
378
-
379
-
380
-
381
-
382
-
383
-
384
-
385
-
386
-
387
-
388
-
389
-
390
 |
 |

75RBS Group Annual Report and Accounts 2009
Taxation
The Group recorded a tax credit of £339 million in 2009, compared with
a tax credit of £1,280 million in 2008.
Earnings
Basic loss per ordinary and B share from continuing operations
improved from 146.2p to a loss of 6.3p. Adjusted loss per ordinary and
B share improved from 43.1p to a loss of 13.2p per share. The number
of ordinary shares in issue increased to 56,366 million at 31 December
2008, compared with 39,456 million in issue at 31 December 2008,
reflecting the placing and open offer in April 2009. The Group also
issued 51 billion B shares to Her Majesty’s Treasury in December 2009.
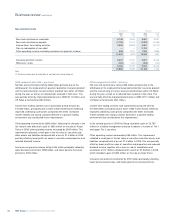
Balance sheet
Total assets of £1,522.5 billion at 31 December 2009 were down £696.2
billion, 31%, compared with 31 December 2008, principally reflecting
substantial repayments of customer loans and advances, as corporate
customer demand fell and corporates looked to deleverage their
balance sheets. Lending to banks also fell in line with significantly
reduced wholesale funding activity. There were also significant falls in
the value of derivative assets, with a corresponding reduction in
derivative liabilities.
Loans and advances to banks decreased by £45.6 billion, 35%, to
£83.9 billion with reverse repurchase agreements and stock borrowing
(‘reverse repos’) down by £23.7 billion, 40% to £35.1 billion and lower
bank placings, down £22.0 billion, 31%, to £48.8 billion, largely as a
result of reduced wholesale funding activity in Global Banking &
Markets.
Loans and advances to customers were down £135.6 billion, 19%, at
£595.7 billion. Within this, reverse repos increased by 4%, £1.8 billion to
£41.0 billion. Excluding reverse repos, lending decreased by £137.3
billion to £554.7 billion or by £131.6 billion, 19%, before impairment
provisions.
Following accession to the Asset Protection Scheme and the issue of B
shares to the UK Government in December 2009, the Group’s Core Tier
1 capital ratio on a proportionally consolidated basis increased to
11.0%, from 5.9% at 31 December 2008. The Core Tier 1 ratio benefited
from 260 basis points of risk-weighted asset relief provided by the APS.
The Tier 1 ratio was 14.4% at 31 December 2009 (2008 – 9.9%) and the
total capital ratio 16.3% (2008 – 14.2%).
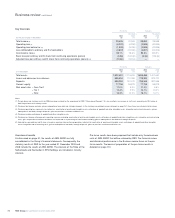
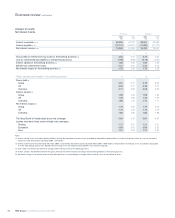
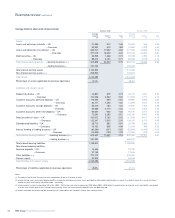
2009 compared with 2008 – statutory
Operating loss
Operating loss before tax for the year was £2,595 million compared with
a loss of £40,836 million in 2008.
Total income
Total income increased 50% to £38,690 million in 2009.
Net interest income
Net interest income decreased by 12% to £16,504 million.
Non-interest income
Non-interest income increased to £22,186 million from £7,193 million in
2008. This included a gain on redemption of own debt of £3,790 million.
Excluding the gain on redemption of own debt, non-interest income
increased by £11,203 million primarily due to the increase in income
from trading activities.
Operating expenses
Operating expenses decreased from £54,202 million in 2008 to £21,478
million of which integration and restructuring costs were £1,286 million
compared with £1,357 million in 2008. Write-down of goodwill and other
intangible assets was £363 million compared with £32,581 million in 2008.
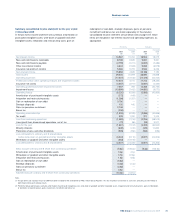
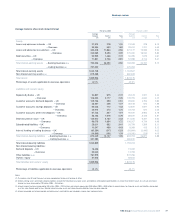
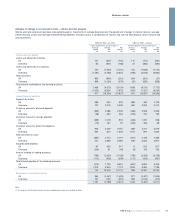
Net insurance claims
Bancassurance and general insurance claims, after reinsurance,
increased by 10% to £4,857 million.
Impairment losses
Impairment losses were £14,950 million, compared with £8,072 million in
2008.
Risk elements in lending and potential problem loans represented 5.5%
of gross loans and advances to customers excluding reverse repos at
31 December 2009 (2008 – 2.5%).
Provision coverage of risk elements in lending and potential problem
loans was 44% (2008 – 51%).
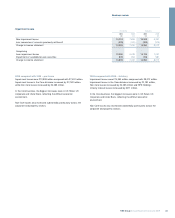
Taxation
The effective tax rate for 2009 was 14.3% compared with 5.7% in 2008.
Earnings
Basic earnings per ordinary and B share, including discontinued
operations, improved from a loss of 146.7p to a loss of 6.4p.
Balance Sheet
Total assets of £1,696.5 billion at 31 December 2009 were down £705.2
billion, 29%, compared with 31 December 2008.
Loans and advances to banks decreased by £46.4 billion, 34%, to
£91.8 billion with reverse repurchase agreements and stock borrowing
(‘reverse repos’) down by £23.7 billion, 40%, to £35.1 billion and lower
bank placings, down £22.7 billion, 29%, to £56.7 billion.
Loans and advances to customers were down £146.3 billion, 17%, at
£728.4 billion. Within this, reverse repos increased by £1.7 billion, 4%, to
£410 billion. Excluding reverse repos, lending decreased by £148.0
billion, 18%, to £687.4 billion or by £141.8 billion, 17%, before
impairment provisions.
Capital
Capital ratios at 31 December 2009 were 11.0% (Core Tier 1), 14.1%
(Tier 1) and 16.1% (Total).
Business review