RBS 2009 Annual Report Download - page 333
Download and view the complete annual report
Please find page 333 of the 2009 RBS annual report below. You can navigate through the pages in the report by either clicking on the pages listed below, or by using the keyword search tool below to find specific information within the annual report.-
 1
1 -
2
-
3
-
4
-
5
-
6
-
7
-
8
-
9
-
10
-
11
-
12
-
13
-
14
-
15
-
16
-
17
-
18
-
19
-
20
-
21
-
22
-
23
-
24
-
25
-
26
-
27
-
28
-
29
-
30
-
31
-
32
-
33
-
34
-
35
-
36
-
37
-
38
-
39
-
40
-
41
-
42
-
43
-
44
-
45
-
46
-
47
-
48
-
49
-
50
-
51
-
52
-
53
-
54
-
55
-
56
-
57
-
58
-
59
-
60
-
61
-
62
-
63
-
64
-
65
-
66
-
67
-
68
-
69
-
70
-
71
-
72
-
73
-
74
-
75
-
76
-
77
-
78
-
79
-
80
-
81
-
82
-
83
-
84
-
85
-
86
-
87
-
88
-
89
-
90
-
91
-
92
-
93
-
94
-
95
-
96
-
97
-
98
-
99
-
100
-
101
-
102
-
103
-
104
-
105
-
106
-
107
-
108
-
109
-
110
-
111
-
112
-
113
-
114
-
115
-
116
-
117
-
118
-
119
-
120
-
121
-
122
-
123
-
124
-
125
-
126
-
127
-
128
-
129
-
130
-
131
-
132
-
133
-
134
-
135
-
136
-
137
-
138
-
139
-
140
-
141
-
142
-
143
-
144
-
145
-
146
-
147
-
148
-
149
-
150
-
151
-
152
-
153
-
154
-
155
-
156
-
157
-
158
-
159
-
160
-
161
-
162
-
163
-
164
-
165
-
166
-
167
-
168
-
169
-
170
-
171
-
172
-
173
-
174
-
175
-
176
-
177
-
178
-
179
-
180
-
181
-
182
-
183
-
184
-
185
-
186
-
187
-
188
-
189
-
190
-
191
-
192
-
193
-
194
-
195
-
196
-
197
-
198
-
199
-
200
-
201
-
202
-
203
-
204
-
205
-
206
-
207
-
208
-
209
-
210
-
211
-
212
-
213
-
214
-
215
-
216
-
217
-
218
-
219
-
220
-
221
-
222
-
223
-
224
-
225
-
226
-
227
-
228
-
229
-
230
-
231
-
232
-
233
-
234
-
235
-
236
-
237
-
238
-
239
-
240
-
241
-
242
-
243
-
244
-
245
-
246
-
247
-
248
-
249
-
250
-
251
-
252
-
253
-
254
-
255
-
256
-
257
-
258
-
259
-
260
-
261
-
262
-
263
-
264
-
265
-
266
-
267
-
268
-
269
-
270
-
271
-
272
-
273
-
274
-
275
-
276
-
277
-
278
-
279
-
280
-
281
-
282
-
283
-
284
-
285
-
286
-
287
-
288
-
289
-
290
-
291
-
292
-
293
-
294
-
295
-
296
-
297
-
298
-
299
-
300
-
301
-
302
-
303
-
304
-
305
-
306
-
307
-
308
-
309
-
310
-
311
-
312
-
313
-
314
-
315
-
316
-
317
-
318
-
319
-
320
-
321
-
322
-
 323
323 -
 324
324 -
 325
325 -
 326
326 -
 327
327 -
 328
328 -
 329
329 -
 330
330 -
 331
331 -
 332
332 -
 333
333 -
 334
334 -
 335
335 -
 336
336 -
 337
337 -
 338
338 -
 339
339 -
 340
340 -
 341
341 -
 342
342 -
 343
343 -
344
-
345
-
346
-
347
-
348
-
349
-
350
-
351
-
352
-
353
-
354
-
355
-
356
-
357
-
358
-
359
-
360
-
361
-
362
-
363
-
364
-
365
-
366
-
367
-
368
-
369
-
370
-
371
-
372
-
373
-
374
-
375
-
376
-
377
-
378
-
379
-
380
-
381
-
382
-
383
-
384
-
385
-
386
-
387
-
388
-
389
-
390
 |
 |

331RBS Group Annual Report and Accounts 2009
Financial statements
Notes on the accounts
It is the Group’s policy to maintain a strong capital base, to expand it as
appropriate and to utilise it efficiently throughout its activities to optimise
the return to shareholders while maintaining a prudent relationship
between the capital base and the underlying risks of the business. In
carrying out this policy, the Group has regard to the supervisory
requirements of the FSA. The FSA uses Risk Asset Ratio (RAR) as a
measure of capital adequacy for UK banks, comparing a bank’s capital
resources with its risk-weighted assets (the assets and off-balance
sheet exposures are ‘weighted’ to reflect the inherent credit and other
risks); by international agreement, the RAR should be not less than 8%
with a Tier 1 component of not less than 4%. The Group has complied
with the FSAs capital requirements throughout the year.
A number of subsidiaries and sub-groups within the Group, principally
banking and insurance entities, are subject to various individual
regulatory capital requirements in the UK and overseas.
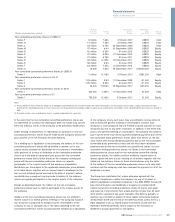
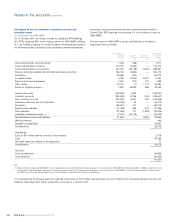
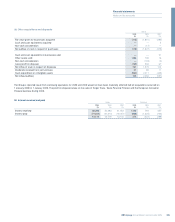
31 Capital resources
The Group’s regulatory capital resources at 31 December in accordance with Financial Services Authority (FSA) definitions were as follows:
2009 2008
Composition of regulatory capital £m £m
Tier 1
Ordinary and B shareholders’ equity 69,890 45,525
Minority interests 16,895 21,619
Adjustment for:
– Goodwill and other intangible assets (17,847) (20,049)
– Goodwill and other intangible assets of discontinued businesses (238) —
– Unrealised losses on available-for-sale debt securities 1,888 3,687
– Reserves arising on revaluation of property and unrealised gains on available-for-sale equities (207) (984)
– Reallocation of preference shares and innovative securities (656) (1,813)
– Other regulatory adjustments (1,184) (362)
Less expected loss over provisions (2,558) (770)
Less securitisation positions (1,353) (663)
Less APS first loss (5,106) —
Core Tier 1 capital 59,524 46,190
Preference shares 11,265 16,655
Innovative Tier 1 securities 5,213 7,383
Tax on the excess of expected losses over provisions 1,020 308
Less deductions from Tier 1 capital (601) (689)
Total Tier 1 capital 76,421 69,847
Tier 2
Reserves arising on revaluation of property and unrealised gains on available-for-sale equities 207 984
Collective impairment allowances 796 666
Perpetual subordinated debt 4,950 9,829
Term subordinated debt 20,063 23,162
Minority and other interests in Tier 2 capital 11 11
Less deductions from Tier 2 capital (5,532) (2,429)
Less APS first loss (5,106) —
Total Tier 2 capital 15,389 32,223
Tier 3 —260
Supervisory deductions
Unconsolidated investments (4,472) (4,044)
Other deductions (93) (111)
Deductions from total capital (4,565) (4,155)
Total regulatory capital 87,245 98,175
Note:
(1) The Group adopted Basel II with effect from 1 January 2008; data for 2007 has not been provided as it is not directly comparable.