RBS 2009 Annual Report Download - page 170
Download and view the complete annual report
Please find page 170 of the 2009 RBS annual report below. You can navigate through the pages in the report by either clicking on the pages listed below, or by using the keyword search tool below to find specific information within the annual report.-
 1
1 -
2
-
3
-
4
-
5
-
6
-
7
-
8
-
9
-
10
-
11
-
12
-
13
-
14
-
15
-
16
-
17
-
18
-
19
-
20
-
21
-
22
-
23
-
24
-
25
-
26
-
27
-
28
-
29
-
30
-
31
-
32
-
33
-
34
-
35
-
36
-
37
-
38
-
39
-
40
-
41
-
42
-
43
-
44
-
45
-
46
-
47
-
48
-
49
-
50
-
51
-
52
-
53
-
54
-
55
-
56
-
57
-
58
-
59
-
60
-
61
-
62
-
63
-
64
-
65
-
66
-
67
-
68
-
69
-
70
-
71
-
72
-
73
-
74
-
75
-
76
-
77
-
78
-
79
-
80
-
81
-
82
-
83
-
84
-
85
-
86
-
87
-
88
-
89
-
90
-
91
-
92
-
93
-
94
-
95
-
96
-
97
-
98
-
99
-
100
-
101
-
102
-
103
-
104
-
105
-
106
-
107
-
108
-
109
-
110
-
111
-
112
-
113
-
114
-
115
-
116
-
117
-
118
-
119
-
120
-
121
-
122
-
123
-
124
-
125
-
126
-
127
-
128
-
129
-
130
-
131
-
132
-
133
-
134
-
135
-
136
-
137
-
138
-
139
-
140
-
141
-
142
-
143
-
144
-
145
-
146
-
147
-
148
-
149
-
150
-
151
-
152
-
153
-
154
-
155
-
156
-
157
-
158
-
159
-
 160
160 -
 161
161 -
 162
162 -
 163
163 -
 164
164 -
 165
165 -
 166
166 -
 167
167 -
 168
168 -
 169
169 -
 170
170 -
 171
171 -
 172
172 -
 173
173 -
 174
174 -
 175
175 -
 176
176 -
 177
177 -
 178
178 -
 179
179 -
 180
180 -
181
-
182
-
183
-
184
-
185
-
186
-
187
-
188
-
189
-
190
-
191
-
192
-
193
-
194
-
195
-
196
-
197
-
198
-
199
-
200
-
201
-
202
-
203
-
204
-
205
-
206
-
207
-
208
-
209
-
210
-
211
-
212
-
213
-
214
-
215
-
216
-
217
-
218
-
219
-
220
-
221
-
222
-
223
-
224
-
225
-
226
-
227
-
228
-
229
-
230
-
231
-
232
-
233
-
234
-
235
-
236
-
237
-
238
-
239
-
240
-
241
-
242
-
243
-
244
-
245
-
246
-
247
-
248
-
249
-
250
-
251
-
252
-
253
-
254
-
255
-
256
-
257
-
258
-
259
-
260
-
261
-
262
-
263
-
264
-
265
-
266
-
267
-
268
-
269
-
270
-
271
-
272
-
273
-
274
-
275
-
276
-
277
-
278
-
279
-
280
-
281
-
282
-
283
-
284
-
285
-
286
-
287
-
288
-
289
-
290
-
291
-
292
-
293
-
294
-
295
-
296
-
297
-
298
-
299
-
300
-
301
-
302
-
303
-
304
-
305
-
306
-
307
-
308
-
309
-
310
-
311
-
312
-
313
-
314
-
315
-
316
-
317
-
318
-
319
-
320
-
321
-
322
-
323
-
324
-
325
-
326
-
327
-
328
-
329
-
330
-
331
-
332
-
333
-
334
-
335
-
336
-
337
-
338
-
339
-
340
-
341
-
342
-
343
-
344
-
345
-
346
-
347
-
348
-
349
-
350
-
351
-
352
-
353
-
354
-
355
-
356
-
357
-
358
-
359
-
360
-
361
-
362
-
363
-
364
-
365
-
366
-
367
-
368
-
369
-
370
-
371
-
372
-
373
-
374
-
375
-
376
-
377
-
378
-
379
-
380
-
381
-
382
-
383
-
384
-
385
-
386
-
387
-
388
-
389
-
390
 |
 |

Business review continued
RBS Group Annual Report and Accounts 2009168
* unaudited
Market risk continued
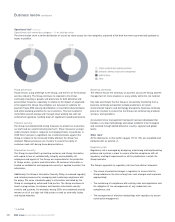
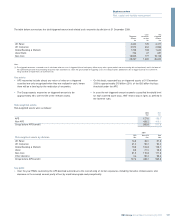
Equity risk
Equity positions are measured at fair value. Fair value calculations are
based on available market prices wherever possible. In the event that
market prices are not available, fair value is based on appropriate
valuation techniques or management estimates.
The types, nature and amounts of exchange-traded exposures, private
equity exposures, and other exposures vary significantly. Such
exposures may take the form of listed and unlisted equity shares, linked
equity fund investments, private equity and venture capital investments,
preference shares classified as equity and Federal Home Loan Stock.
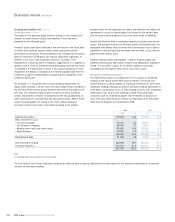
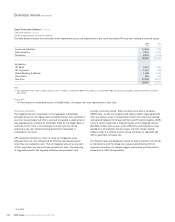
The table below sets out the Group’s banking book equity exposures at
31 December 2009.
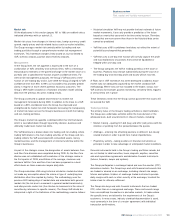
Risk control*
The prime risk control mechanism for non-traded market risk exposures
is the completion of monthly or quarterly IRRBB and quarterly FXRBB
returns by the Group’s business units, collated as part of month-end
reporting by Group Treasury to GALCO.
Financial control functions are required to confirm to Group Treasury
that returns materially capture all balance sheet items and thus
reconcile to core source systems.
Monthly or quarterly returns by the Group’s business units, collated as
part of regular reporting by Group Treasury to GALCO, are used to
build a Group IRRBB VaR position and to ensure businesses comply
with materiality limits on a pre and post hedge basis for interest rates, as
stipulated by Group Treasury. For FXRBB, the Group policy states that
any foreign currency exposure is managed to de-minimus limits. Group
Treasury monitors adherence to this policy by way of a quarterly return.
For both IRRBB and FXRBB, information is included in regulatory and
statutory returns.
Group Market Risk exercise independent oversight and governance of the
interest rate and foreign exchange exposures managed in Group Treasury
by granting market risk limits in addition to authorising Group Treasury to
deal in specific instruments for the purpose of managing the Group's
non-trading interest rate and foreign exchange exposures. All market risk
methodologies that relate to limits specified under this delegated authority
are applied under the direction of Group Market Risk.
Listed Unlisted Total
Equity exposures (1) £m £m £m
Group before RFS Holdings minority interest 401 2,388 2,789
RFS Holdings minority interest 60 211 271
Group 461 2,599 3,060
Note:
(1) Excludes equity exposures held-for-trading purposes and by insurance/assurance entities.