RBS 2009 Annual Report Download - page 360
Download and view the complete annual report
Please find page 360 of the 2009 RBS annual report below. You can navigate through the pages in the report by either clicking on the pages listed below, or by using the keyword search tool below to find specific information within the annual report.-
 1
1 -
2
-
3
-
4
-
5
-
6
-
7
-
8
-
9
-
10
-
11
-
12
-
13
-
14
-
15
-
16
-
17
-
18
-
19
-
20
-
21
-
22
-
23
-
24
-
25
-
26
-
27
-
28
-
29
-
30
-
31
-
32
-
33
-
34
-
35
-
36
-
37
-
38
-
39
-
40
-
41
-
42
-
43
-
44
-
45
-
46
-
47
-
48
-
49
-
50
-
51
-
52
-
53
-
54
-
55
-
56
-
57
-
58
-
59
-
60
-
61
-
62
-
63
-
64
-
65
-
66
-
67
-
68
-
69
-
70
-
71
-
72
-
73
-
74
-
75
-
76
-
77
-
78
-
79
-
80
-
81
-
82
-
83
-
84
-
85
-
86
-
87
-
88
-
89
-
90
-
91
-
92
-
93
-
94
-
95
-
96
-
97
-
98
-
99
-
100
-
101
-
102
-
103
-
104
-
105
-
106
-
107
-
108
-
109
-
110
-
111
-
112
-
113
-
114
-
115
-
116
-
117
-
118
-
119
-
120
-
121
-
122
-
123
-
124
-
125
-
126
-
127
-
128
-
129
-
130
-
131
-
132
-
133
-
134
-
135
-
136
-
137
-
138
-
139
-
140
-
141
-
142
-
143
-
144
-
145
-
146
-
147
-
148
-
149
-
150
-
151
-
152
-
153
-
154
-
155
-
156
-
157
-
158
-
159
-
160
-
161
-
162
-
163
-
164
-
165
-
166
-
167
-
168
-
169
-
170
-
171
-
172
-
173
-
174
-
175
-
176
-
177
-
178
-
179
-
180
-
181
-
182
-
183
-
184
-
185
-
186
-
187
-
188
-
189
-
190
-
191
-
192
-
193
-
194
-
195
-
196
-
197
-
198
-
199
-
200
-
201
-
202
-
203
-
204
-
205
-
206
-
207
-
208
-
209
-
210
-
211
-
212
-
213
-
214
-
215
-
216
-
217
-
218
-
219
-
220
-
221
-
222
-
223
-
224
-
225
-
226
-
227
-
228
-
229
-
230
-
231
-
232
-
233
-
234
-
235
-
236
-
237
-
238
-
239
-
240
-
241
-
242
-
243
-
244
-
245
-
246
-
247
-
248
-
249
-
250
-
251
-
252
-
253
-
254
-
255
-
256
-
257
-
258
-
259
-
260
-
261
-
262
-
263
-
264
-
265
-
266
-
267
-
268
-
269
-
270
-
271
-
272
-
273
-
274
-
275
-
276
-
277
-
278
-
279
-
280
-
281
-
282
-
283
-
284
-
285
-
286
-
287
-
288
-
289
-
290
-
291
-
292
-
293
-
294
-
295
-
296
-
297
-
298
-
299
-
300
-
301
-
302
-
303
-
304
-
305
-
306
-
307
-
308
-
309
-
310
-
311
-
312
-
313
-
314
-
315
-
316
-
317
-
318
-
319
-
320
-
321
-
322
-
323
-
324
-
325
-
326
-
327
-
328
-
329
-
330
-
331
-
332
-
333
-
334
-
335
-
336
-
337
-
338
-
339
-
340
-
341
-
342
-
343
-
344
-
345
-
346
-
347
-
348
-
349
-
 350
350 -
 351
351 -
 352
352 -
 353
353 -
 354
354 -
 355
355 -
 356
356 -
 357
357 -
 358
358 -
 359
359 -
 360
360 -
 361
361 -
 362
362 -
 363
363 -
 364
364 -
 365
365 -
 366
366 -
 367
367 -
 368
368 -
 369
369 -
 370
370 -
371
-
372
-
373
-
374
-
375
-
376
-
377
-
378
-
379
-
380
-
381
-
382
-
383
-
384
-
385
-
386
-
387
-
388
-
389
-
390
 |
 |

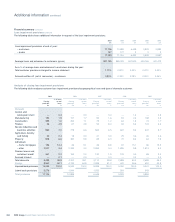
Additional information continued
RBS Group Annual Report and Accounts 2009358
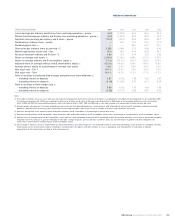
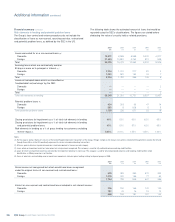
Financial summary continued
Short-term borrowings 2009 2008 2007
£m £m £m
Commercial paper
Outstanding at year end 44,473 78,581 78,612
Maximum outstanding at any month end during the year 74,656 111,108 81,187
Approximate average amount during the year 58,615 98,150 32,498
Approximate weighted average interest rate during the year 1.2% 3.3% 4.8%
Approximate weighted average interest rate at year end 1.2% 3.0% 5.5%
Other short-term borrowings
Outstanding at year end 138,951 194,346 280,526
Maximum outstanding at any month end during the year 202,812 395,132 312,557
Approximate average amount during the year 162,235 299,513 188,326
Approximate weighted average interest rate during the year 1.4% 3.2% 4.6%
Approximate weighted average interest rate at year end 0.4% 2.5% 4.1%
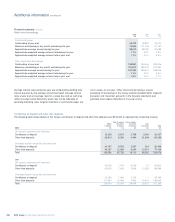
Average interest rates during the year are computed by dividing total
interest expense by the average amount borrowed. Average interest
rates at year end are average rates for a single day and as such may
reflect one-day market distortions which may not be indicative of
generally prevailing rates. Original maturities of commercial paper are
not in excess of one year. ‘Other short-term borrowings’ consist
principally of borrowings in the money markets included within ‘Deposits
by banks’ and ‘Customer accounts’ in the financial statements and
generally have original maturities of one year or less.
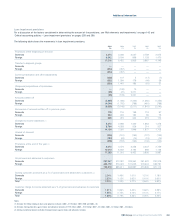
Certificates of deposit and other time deposits
The following table shows details of the Group’s certificates of deposit and other time deposits over $100,000 or equivalent by remaining maturity.
Over 3 months Over 6 months
Within but within but within Over
3 months 6 months 12 months 12 months Total
2009 £m £m £m £m £m
UK based companies and branches
Certificates of deposit 13,329 6,673 2,795 3,240 26,037
Other time deposits 50,913 8,083 4,484 21,609 85,089
Overseas based companies and branches
Certificates of deposit 24,157 8,503 2,567 218 35,445
Other time deposits 45,157 12,469 6,264 13,215 77,105
Total 133,556 35,728 16,110 38,282 223,676
2008
UK based companies and branches
Certificates of deposit 23,076 7,475 9,236 13 39,800
Other time deposits 62,623 7,665 5,939 12,359 88,586
Overseas based companies and branches
Certificates of deposit 32,263 1,666 1,316 — 35,245
Other time deposits 111,542 13,498 7,983 15,641 148,664
Total 229,504 30,304 24,474 28,013 312,295