RBS 2009 Annual Report Download - page 141
Download and view the complete annual report
Please find page 141 of the 2009 RBS annual report below. You can navigate through the pages in the report by either clicking on the pages listed below, or by using the keyword search tool below to find specific information within the annual report.-
 1
1 -
2
-
3
-
4
-
5
-
6
-
7
-
8
-
9
-
10
-
11
-
12
-
13
-
14
-
15
-
16
-
17
-
18
-
19
-
20
-
21
-
22
-
23
-
24
-
25
-
26
-
27
-
28
-
29
-
30
-
31
-
32
-
33
-
34
-
35
-
36
-
37
-
38
-
39
-
40
-
41
-
42
-
43
-
44
-
45
-
46
-
47
-
48
-
49
-
50
-
51
-
52
-
53
-
54
-
55
-
56
-
57
-
58
-
59
-
60
-
61
-
62
-
63
-
64
-
65
-
66
-
67
-
68
-
69
-
70
-
71
-
72
-
73
-
74
-
75
-
76
-
77
-
78
-
79
-
80
-
81
-
82
-
83
-
84
-
85
-
86
-
87
-
88
-
89
-
90
-
91
-
92
-
93
-
94
-
95
-
96
-
97
-
98
-
99
-
100
-
101
-
102
-
103
-
104
-
105
-
106
-
107
-
108
-
109
-
110
-
111
-
112
-
113
-
114
-
115
-
116
-
117
-
118
-
119
-
120
-
121
-
122
-
123
-
124
-
125
-
126
-
127
-
128
-
129
-
130
-
 131
131 -
 132
132 -
 133
133 -
 134
134 -
 135
135 -
 136
136 -
 137
137 -
 138
138 -
 139
139 -
 140
140 -
 141
141 -
 142
142 -
 143
143 -
 144
144 -
 145
145 -
 146
146 -
 147
147 -
 148
148 -
 149
149 -
 150
150 -
 151
151 -
152
-
153
-
154
-
155
-
156
-
157
-
158
-
159
-
160
-
161
-
162
-
163
-
164
-
165
-
166
-
167
-
168
-
169
-
170
-
171
-
172
-
173
-
174
-
175
-
176
-
177
-
178
-
179
-
180
-
181
-
182
-
183
-
184
-
185
-
186
-
187
-
188
-
189
-
190
-
191
-
192
-
193
-
194
-
195
-
196
-
197
-
198
-
199
-
200
-
201
-
202
-
203
-
204
-
205
-
206
-
207
-
208
-
209
-
210
-
211
-
212
-
213
-
214
-
215
-
216
-
217
-
218
-
219
-
220
-
221
-
222
-
223
-
224
-
225
-
226
-
227
-
228
-
229
-
230
-
231
-
232
-
233
-
234
-
235
-
236
-
237
-
238
-
239
-
240
-
241
-
242
-
243
-
244
-
245
-
246
-
247
-
248
-
249
-
250
-
251
-
252
-
253
-
254
-
255
-
256
-
257
-
258
-
259
-
260
-
261
-
262
-
263
-
264
-
265
-
266
-
267
-
268
-
269
-
270
-
271
-
272
-
273
-
274
-
275
-
276
-
277
-
278
-
279
-
280
-
281
-
282
-
283
-
284
-
285
-
286
-
287
-
288
-
289
-
290
-
291
-
292
-
293
-
294
-
295
-
296
-
297
-
298
-
299
-
300
-
301
-
302
-
303
-
304
-
305
-
306
-
307
-
308
-
309
-
310
-
311
-
312
-
313
-
314
-
315
-
316
-
317
-
318
-
319
-
320
-
321
-
322
-
323
-
324
-
325
-
326
-
327
-
328
-
329
-
330
-
331
-
332
-
333
-
334
-
335
-
336
-
337
-
338
-
339
-
340
-
341
-
342
-
343
-
344
-
345
-
346
-
347
-
348
-
349
-
350
-
351
-
352
-
353
-
354
-
355
-
356
-
357
-
358
-
359
-
360
-
361
-
362
-
363
-
364
-
365
-
366
-
367
-
368
-
369
-
370
-
371
-
372
-
373
-
374
-
375
-
376
-
377
-
378
-
379
-
380
-
381
-
382
-
383
-
384
-
385
-
386
-
387
-
388
-
389
-
390
 |
 |

Business review
Risk, capital and liquidity management
139RBS Group Annual Report and Accounts 2009
The Group’s shipping portfolio is primarily focused on fully secured
mortgage finance business in the dry bulk and tanker sectors, with a
limited exposure to container vessels.
The performance of the sector over the past twelve months has been
materially impacted by both the global downturn and the high volume of
new capacity that has been delivered and will continue to come on
stream into 2011.
The Group’s strategy is to focus on cash flows relating to the ships
financed and to work with long-term industry participants in Europe and
North America where the Group has long-standing relationships and
where the companies have demonstrated an ability to withstand cyclical
down turns with a consistent track record through cyclical volatility.
Asset selection has been to focus on modern tonnage (average vessel
age is eight years).
The Group has refined its strategy during the course of 2009 to define a
core business focussed on a well established client base of owners in
Europe and North America where the Group has long-standing
relationships with companies that have a demonstrated ability to
withstand cyclical downturns.
The performance of the portfolio reflects a rising level of stress with a
number of transactions restructured in response to asset price
reductions and security covenant breaches. The value of the fleet is
reviewed on a quarterly basis and a large majority of deals remain fully
secured. There have been few instances of payment default and in the
majority of cases owners have supported transactions via cash
injections. Cases on the Group’s watch list that are more closely
monitored and controlled have increased and now stand at £1 billion, or
7% of the total portfolio.
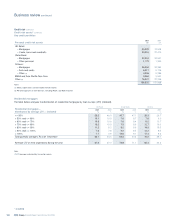
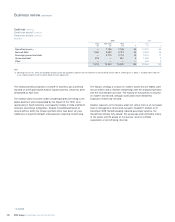
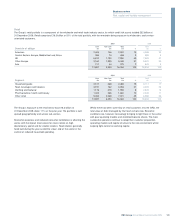
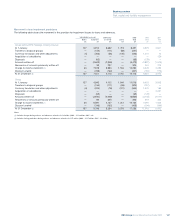
Shipping
2009 2008
Core Non-Core Total Total
Sector £m £m £m % £m %
Dry bulk 2,568 777 3,345 28 3,775 28
Tankers 3,103 1,640 4,743 39 4,975 37
Container 756 685 1,441 12 1,256 10
Gas/offshore 137 1,851 1,988 16 1,786 13
Other 168 419 587 5 1,549 12
6,732 5,372 12,104 100 13,341 100
Note:
(1) Figures shown relate to direct shipping financing exposure and do not include related operating lease and counterparty exposures of £1.1 billion in 2009 and £3.3 billion in 2008.