RBS 2009 Annual Report Download - page 197
Download and view the complete annual report
Please find page 197 of the 2009 RBS annual report below. You can navigate through the pages in the report by either clicking on the pages listed below, or by using the keyword search tool below to find specific information within the annual report.-
 1
1 -
2
-
3
-
4
-
5
-
6
-
7
-
8
-
9
-
10
-
11
-
12
-
13
-
14
-
15
-
16
-
17
-
18
-
19
-
20
-
21
-
22
-
23
-
24
-
25
-
26
-
27
-
28
-
29
-
30
-
31
-
32
-
33
-
34
-
35
-
36
-
37
-
38
-
39
-
40
-
41
-
42
-
43
-
44
-
45
-
46
-
47
-
48
-
49
-
50
-
51
-
52
-
53
-
54
-
55
-
56
-
57
-
58
-
59
-
60
-
61
-
62
-
63
-
64
-
65
-
66
-
67
-
68
-
69
-
70
-
71
-
72
-
73
-
74
-
75
-
76
-
77
-
78
-
79
-
80
-
81
-
82
-
83
-
84
-
85
-
86
-
87
-
88
-
89
-
90
-
91
-
92
-
93
-
94
-
95
-
96
-
97
-
98
-
99
-
100
-
101
-
102
-
103
-
104
-
105
-
106
-
107
-
108
-
109
-
110
-
111
-
112
-
113
-
114
-
115
-
116
-
117
-
118
-
119
-
120
-
121
-
122
-
123
-
124
-
125
-
126
-
127
-
128
-
129
-
130
-
131
-
132
-
133
-
134
-
135
-
136
-
137
-
138
-
139
-
140
-
141
-
142
-
143
-
144
-
145
-
146
-
147
-
148
-
149
-
150
-
151
-
152
-
153
-
154
-
155
-
156
-
157
-
158
-
159
-
160
-
161
-
162
-
163
-
164
-
165
-
166
-
167
-
168
-
169
-
170
-
171
-
172
-
173
-
174
-
175
-
176
-
177
-
178
-
179
-
180
-
181
-
182
-
183
-
184
-
185
-
186
-
 187
187 -
 188
188 -
 189
189 -
 190
190 -
 191
191 -
 192
192 -
 193
193 -
 194
194 -
 195
195 -
 196
196 -
 197
197 -
 198
198 -
 199
199 -
 200
200 -
 201
201 -
 202
202 -
 203
203 -
 204
204 -
 205
205 -
 206
206 -
 207
207 -
208
-
209
-
210
-
211
-
212
-
213
-
214
-
215
-
216
-
217
-
218
-
219
-
220
-
221
-
222
-
223
-
224
-
225
-
226
-
227
-
228
-
229
-
230
-
231
-
232
-
233
-
234
-
235
-
236
-
237
-
238
-
239
-
240
-
241
-
242
-
243
-
244
-
245
-
246
-
247
-
248
-
249
-
250
-
251
-
252
-
253
-
254
-
255
-
256
-
257
-
258
-
259
-
260
-
261
-
262
-
263
-
264
-
265
-
266
-
267
-
268
-
269
-
270
-
271
-
272
-
273
-
274
-
275
-
276
-
277
-
278
-
279
-
280
-
281
-
282
-
283
-
284
-
285
-
286
-
287
-
288
-
289
-
290
-
291
-
292
-
293
-
294
-
295
-
296
-
297
-
298
-
299
-
300
-
301
-
302
-
303
-
304
-
305
-
306
-
307
-
308
-
309
-
310
-
311
-
312
-
313
-
314
-
315
-
316
-
317
-
318
-
319
-
320
-
321
-
322
-
323
-
324
-
325
-
326
-
327
-
328
-
329
-
330
-
331
-
332
-
333
-
334
-
335
-
336
-
337
-
338
-
339
-
340
-
341
-
342
-
343
-
344
-
345
-
346
-
347
-
348
-
349
-
350
-
351
-
352
-
353
-
354
-
355
-
356
-
357
-
358
-
359
-
360
-
361
-
362
-
363
-
364
-
365
-
366
-
367
-
368
-
369
-
370
-
371
-
372
-
373
-
374
-
375
-
376
-
377
-
378
-
379
-
380
-
381
-
382
-
383
-
384
-
385
-
386
-
387
-
388
-
389
-
390
 |
 |

Business review
Risk, capital and liquidity management
195RBS Group Annual Report and Accounts 2009
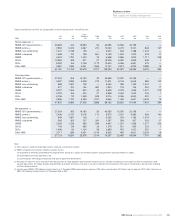
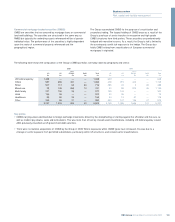
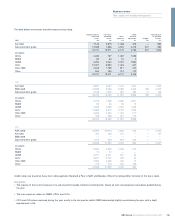
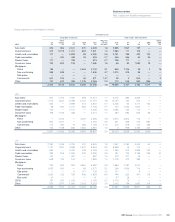
The table below summarises monoline exposures by rating.
Notional amount: Fair value: Credit Net exposure
protected protected Gross valuation to monoline
assets assets exposure adjustment Hedges insurers
2009 £m £m £m £m £m £m
AA rated 7,143 5,875 1,268 378 — 890
Sub-investment grade 12,598 7,696 4,902 3,418 531 953
19,741 13,571 6,170 3,796 531 1,843
Of which:
CDOs 2,284 797 1,487 1,059
RMBS 82 66 16 2
CMBS 4,253 2,034 2,219 1,562
CLOs 10,007 8,584 1,423 641
Other ABS 2,606 1,795 811 410
Other 509 295 214 122
19,741 13,571 6,170 3,796
2008
AA rated 8,937 6,537 2,400 1,067 — 1,333
BBB rated 16,895 8,396 8,499 4,426 768 3,305
Sub-investment grade 2,188 1,506 682 495 21 166
28,020 16,439 11,581 5,988 789 4,804
Of which:
CDOs 5,779 1,395 4,384 2,201
RMBS 93 65 28 10
CMBS 4,849 2,388 2,461 1,429
CLOs 12,865 9,673 3,192 1,556
Other ABS 3,666 2,460 1,206 617
Other 768 458 310 175
28,020 16,439 11,581 5,988
2007
AAA rated 23,596 20,913 2,683 243 — 2,440
AA rated 300 193 107 — — 107
BBB rated ——————
Sub-investment grade 1,072 453 619 619 — —
24,968 21,559 3,409 862 — 2,547
Of which:
CDOs 5,894 3,459 2,435 615
RMBS 73 73 — —
CMBS 3,731 3,421 310 34
CLOs 9,941 9,702 239 44
Other ABS 4,553 4,388 165 14
Other 776 516 260 155
24,968 21,559 3,409 862
Credit ratings are based on those from rating agencies Standard & Poor’s (S&P) and Moody’s. Where the ratings differ, the lower of the two is taken.
Key points
•The majority of the current exposure is to sub-investment grade monoline counterparties. Nearly all such counterparties were down-graded during
the year.
•The main exposure relates to CMBS, CDOs and CLOs.
•CDO and CLO prices improved during the year, mostly in the last quarter, whilst CMBS deteriorated slightly overall during the year, with a slight
improvement in Q4.