RBS 2009 Annual Report Download - page 344
Download and view the complete annual report
Please find page 344 of the 2009 RBS annual report below. You can navigate through the pages in the report by either clicking on the pages listed below, or by using the keyword search tool below to find specific information within the annual report.-
 1
1 -
2
-
3
-
4
-
5
-
6
-
7
-
8
-
9
-
10
-
11
-
12
-
13
-
14
-
15
-
16
-
17
-
18
-
19
-
20
-
21
-
22
-
23
-
24
-
25
-
26
-
27
-
28
-
29
-
30
-
31
-
32
-
33
-
34
-
35
-
36
-
37
-
38
-
39
-
40
-
41
-
42
-
43
-
44
-
45
-
46
-
47
-
48
-
49
-
50
-
51
-
52
-
53
-
54
-
55
-
56
-
57
-
58
-
59
-
60
-
61
-
62
-
63
-
64
-
65
-
66
-
67
-
68
-
69
-
70
-
71
-
72
-
73
-
74
-
75
-
76
-
77
-
78
-
79
-
80
-
81
-
82
-
83
-
84
-
85
-
86
-
87
-
88
-
89
-
90
-
91
-
92
-
93
-
94
-
95
-
96
-
97
-
98
-
99
-
100
-
101
-
102
-
103
-
104
-
105
-
106
-
107
-
108
-
109
-
110
-
111
-
112
-
113
-
114
-
115
-
116
-
117
-
118
-
119
-
120
-
121
-
122
-
123
-
124
-
125
-
126
-
127
-
128
-
129
-
130
-
131
-
132
-
133
-
134
-
135
-
136
-
137
-
138
-
139
-
140
-
141
-
142
-
143
-
144
-
145
-
146
-
147
-
148
-
149
-
150
-
151
-
152
-
153
-
154
-
155
-
156
-
157
-
158
-
159
-
160
-
161
-
162
-
163
-
164
-
165
-
166
-
167
-
168
-
169
-
170
-
171
-
172
-
173
-
174
-
175
-
176
-
177
-
178
-
179
-
180
-
181
-
182
-
183
-
184
-
185
-
186
-
187
-
188
-
189
-
190
-
191
-
192
-
193
-
194
-
195
-
196
-
197
-
198
-
199
-
200
-
201
-
202
-
203
-
204
-
205
-
206
-
207
-
208
-
209
-
210
-
211
-
212
-
213
-
214
-
215
-
216
-
217
-
218
-
219
-
220
-
221
-
222
-
223
-
224
-
225
-
226
-
227
-
228
-
229
-
230
-
231
-
232
-
233
-
234
-
235
-
236
-
237
-
238
-
239
-
240
-
241
-
242
-
243
-
244
-
245
-
246
-
247
-
248
-
249
-
250
-
251
-
252
-
253
-
254
-
255
-
256
-
257
-
258
-
259
-
260
-
261
-
262
-
263
-
264
-
265
-
266
-
267
-
268
-
269
-
270
-
271
-
272
-
273
-
274
-
275
-
276
-
277
-
278
-
279
-
280
-
281
-
282
-
283
-
284
-
285
-
286
-
287
-
288
-
289
-
290
-
291
-
292
-
293
-
294
-
295
-
296
-
297
-
298
-
299
-
300
-
301
-
302
-
303
-
304
-
305
-
306
-
307
-
308
-
309
-
310
-
311
-
312
-
313
-
314
-
315
-
316
-
317
-
318
-
319
-
320
-
321
-
322
-
323
-
324
-
325
-
326
-
327
-
328
-
329
-
330
-
331
-
332
-
333
-
 334
334 -
 335
335 -
 336
336 -
 337
337 -
 338
338 -
 339
339 -
 340
340 -
 341
341 -
 342
342 -
 343
343 -
 344
344 -
 345
345 -
 346
346 -
 347
347 -
 348
348 -
 349
349 -
 350
350 -
 351
351 -
 352
352 -
 353
353 -
 354
354 -
355
-
356
-
357
-
358
-
359
-
360
-
361
-
362
-
363
-
364
-
365
-
366
-
367
-
368
-
369
-
370
-
371
-
372
-
373
-
374
-
375
-
376
-
377
-
378
-
379
-
380
-
381
-
382
-
383
-
384
-
385
-
386
-
387
-
388
-
389
-
390
 |
 |

RBS Group Annual Report and Accounts 2009342
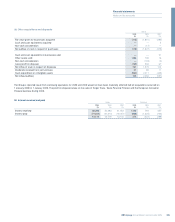
Notes on the accounts continued
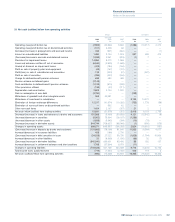
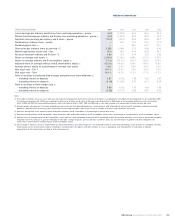
38 Segmental analysis continued Group
Operating
Net Non- expenses and Depreciation
interest interest Total insurance and Impairment Operating
income income income claims amortisation losses profit/(loss)
2009 £m £m £m £m £m £m £m
UK Retail 3,452 1,629 5,081 (3,170) (3) (1,679) 229
UK Corporate 2,292 1,290 3,582 (1,376) (154) (927) 1,125
Wealth 663 446 1,109 (645) (11) (33) 420
Global Banking & Markets 2,375 8,634 11,009 (4,482) (178) (640) 5,709
Global Transaction Services 912 1,575 2,487 (1,462) (13) (39) 973
Ulster Bank 780 254 1,034 (748) (5) (649) (368)
US Retail & Commercial 1,775 949 2,724 (2,063) (72) (702) (113)
RBS Insurance 354 4,106 4,460 (4,363) (31) (8) 58
Central items (284) 524 240 1,017 (964) (1) 292
Core 12,319 19,407 31,726 (17,292) (1,431) (4,678) 8,325
Non-Core 1,248 (3,549) (2,301) (2,593) (442) (9,221) (14,557)
13,567 15,858 29,425 (19,885) (1,873) (13,899) (6,232)
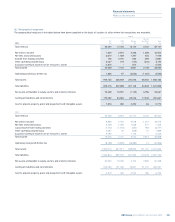
Reconciling items
RFS Holdings minority interest 2,937 2,406 5,343 (3,950) (646) (1,051) (304)
Amortisation of purchased intangible assets ————(272) — (272)
Write-down of goodwill — — — (363) — — (363)
Integration and restructuring costs — — — (1,268) (18) — (1,286)
Gain on redemption of own debt — 3,790 3,790 — — — 3,790
Strategic disposals — 132 132 — — — 132
Gains on pensions curtailment — — — 2,148 — — 2,148
Bonus tax — — — (208) — — (208)
16,504 22,186 38,690 (23,526) (2,809) (14,950) (2,595)
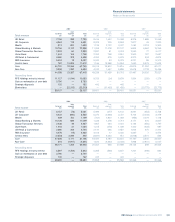
2008
UK Retail 3,187 1,935 5,122 (3,378) (2) (1,019) 723
UK Corporate 2,448 1,289 3,737 (1,487) (150) (319) 1,781
Wealth 578 481 1,059 (686) (9) (16) 348
Global Banking & Markets 2,326 388 2,714 (3,705) (283) (522) (1,796)
Global Transaction Services 937 1,494 2,431 (1,372) (3) (54) 1,002
Ulster Bank 708 331 1,039 (715) — (106) 218
US Retail & Commercial 1,726 861 2,587 (1,471) (151) (437) 528
RBS Insurance 496 3,934 4,430 (3,767) (37) (42) 584
Central items 1,710 (1,198) 512 1,148 (654) 19 1,025
Core 14,116 9,515 23,631 (15,433) (1,289) (2,496) 4,413
Non-Core 1,648 (4,680) (3,032) (2,840) (543) (4,936) (11,351)
15,764 4,835 20,599 (18,273) (1,832) (7,432) (6,938)
Reconciling items
RFS Holdings minority interest 2,911 1,916 4,827 (3,303) (843) (640) 41
Amortisation of purchased intangible assets ————(443) — (443)
Write-down of goodwill and other intangible assets — — — (32,581) — — (32,581)
Integration and restructuring costs — — — (1,321) (36) — (1,357)
Strategic disposals — 442 442 — — — 442
18,675 7,193 25,868 (55,478) (3,154) (8,072) (40,836)
2007
UK Retail 3,230 2,508 5,738 (3,525) (6) (975) 1,232
UK Corporate 2,252 1,227 3,479 (1,378) (120) (178) 1,803
Wealth 653 465 1,118 (613) (11) (3) 491
Global Banking & Markets 418 3,429 3,847 (2,624) (133) (66) 1,024
Global Transaction Services 647 1,150 1,797 (888) — (14) 895
Ulster Bank 659 328 987 (619) (5) (46) 317
US Retail & Commercial 1,613 801 2,414 (1,312) (113) (246) 743
RBS Insurance 514 4,060 4,574 (3,987) (45) — 542
Central items 497 56 553 893 (598) (3) 845
Core 10,483 14,024 24,507 (14,053) (1,031) (1,531) 7,892
Non-Core 1,041 3,986 5,027 (1,920) (561) (399) 2,147
11,524 18,010 29,534 (15,973) (1,592) (1,930) 10,039
Reconciling items
RFS Holdings minority interest 545 287 832 (573) (58) (38) 163
Amortisation of purchased intangible assets — — — (40) (222) — (262)
Integration and restructuring costs — — — (48) (60) — (108)
12,069 18,297 30,366 (16,634) (1,932) (1,968) 9,832