RBS 2009 Annual Report Download - page 356
Download and view the complete annual report
Please find page 356 of the 2009 RBS annual report below. You can navigate through the pages in the report by either clicking on the pages listed below, or by using the keyword search tool below to find specific information within the annual report.-
 1
1 -
2
-
3
-
4
-
5
-
6
-
7
-
8
-
9
-
10
-
11
-
12
-
13
-
14
-
15
-
16
-
17
-
18
-
19
-
20
-
21
-
22
-
23
-
24
-
25
-
26
-
27
-
28
-
29
-
30
-
31
-
32
-
33
-
34
-
35
-
36
-
37
-
38
-
39
-
40
-
41
-
42
-
43
-
44
-
45
-
46
-
47
-
48
-
49
-
50
-
51
-
52
-
53
-
54
-
55
-
56
-
57
-
58
-
59
-
60
-
61
-
62
-
63
-
64
-
65
-
66
-
67
-
68
-
69
-
70
-
71
-
72
-
73
-
74
-
75
-
76
-
77
-
78
-
79
-
80
-
81
-
82
-
83
-
84
-
85
-
86
-
87
-
88
-
89
-
90
-
91
-
92
-
93
-
94
-
95
-
96
-
97
-
98
-
99
-
100
-
101
-
102
-
103
-
104
-
105
-
106
-
107
-
108
-
109
-
110
-
111
-
112
-
113
-
114
-
115
-
116
-
117
-
118
-
119
-
120
-
121
-
122
-
123
-
124
-
125
-
126
-
127
-
128
-
129
-
130
-
131
-
132
-
133
-
134
-
135
-
136
-
137
-
138
-
139
-
140
-
141
-
142
-
143
-
144
-
145
-
146
-
147
-
148
-
149
-
150
-
151
-
152
-
153
-
154
-
155
-
156
-
157
-
158
-
159
-
160
-
161
-
162
-
163
-
164
-
165
-
166
-
167
-
168
-
169
-
170
-
171
-
172
-
173
-
174
-
175
-
176
-
177
-
178
-
179
-
180
-
181
-
182
-
183
-
184
-
185
-
186
-
187
-
188
-
189
-
190
-
191
-
192
-
193
-
194
-
195
-
196
-
197
-
198
-
199
-
200
-
201
-
202
-
203
-
204
-
205
-
206
-
207
-
208
-
209
-
210
-
211
-
212
-
213
-
214
-
215
-
216
-
217
-
218
-
219
-
220
-
221
-
222
-
223
-
224
-
225
-
226
-
227
-
228
-
229
-
230
-
231
-
232
-
233
-
234
-
235
-
236
-
237
-
238
-
239
-
240
-
241
-
242
-
243
-
244
-
245
-
246
-
247
-
248
-
249
-
250
-
251
-
252
-
253
-
254
-
255
-
256
-
257
-
258
-
259
-
260
-
261
-
262
-
263
-
264
-
265
-
266
-
267
-
268
-
269
-
270
-
271
-
272
-
273
-
274
-
275
-
276
-
277
-
278
-
279
-
280
-
281
-
282
-
283
-
284
-
285
-
286
-
287
-
288
-
289
-
290
-
291
-
292
-
293
-
294
-
295
-
296
-
297
-
298
-
299
-
300
-
301
-
302
-
303
-
304
-
305
-
306
-
307
-
308
-
309
-
310
-
311
-
312
-
313
-
314
-
315
-
316
-
317
-
318
-
319
-
320
-
321
-
322
-
323
-
324
-
325
-
326
-
327
-
328
-
329
-
330
-
331
-
332
-
333
-
334
-
335
-
336
-
337
-
338
-
339
-
340
-
341
-
342
-
343
-
344
-
345
-
 346
346 -
 347
347 -
 348
348 -
 349
349 -
 350
350 -
 351
351 -
 352
352 -
 353
353 -
 354
354 -
 355
355 -
 356
356 -
 357
357 -
 358
358 -
 359
359 -
 360
360 -
 361
361 -
 362
362 -
 363
363 -
 364
364 -
 365
365 -
 366
366 -
367
-
368
-
369
-
370
-
371
-
372
-
373
-
374
-
375
-
376
-
377
-
378
-
379
-
380
-
381
-
382
-
383
-
384
-
385
-
386
-
387
-
388
-
389
-
390
 |
 |

Additional information continued
RBS Group Annual Report and Accounts 2009354
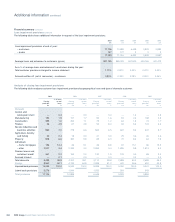
Financial summary continued
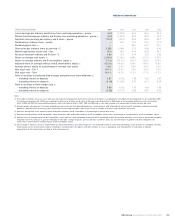
Loan impairment provisions continued
The following table shows additional information in respect of the loan impairment provisions.
2009 2008 2007 2006 2005
£m £m £m £m £m
Loan impairment provisions at end of year:
– customers 17,126 10,889 6,449 3,933 3,884
– banks 157 127323
17,283 11,016 6,452 3,935 3,887
Average loans and advances to customers (gross) 821,155 858,333 567,900 445,766 402,473
As a % of average loans and advances to customers during the year:
Total customer provisions charged to income statement 1.72% 0.81% 0.34% 0.42% 0.42%
Amounts written-off (net of recoveries) – customers 0.80% 0.33% 0.29% 0.36% 0.46%
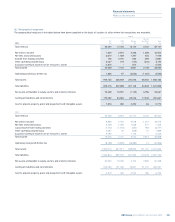
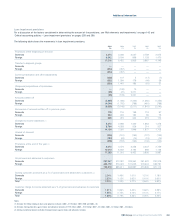
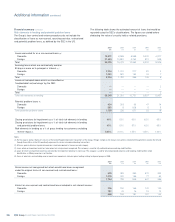
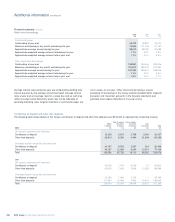
Analysis of closing loan impairment provisions
The following table analyses customer loan impairment provisions by geographical area and type of domestic customer.
2009 2008 2007 2006 2005
% of loans % of loans % of loans % of loans % of loans
Closing to total Closing to total Closing to total Closing to total Closing to total
provision loans provision loans provision loans provision loans provision loans
£m % £m % £m % £m % £m %
Domestic
Central and
local government — 0.4 — 0.3 — 0.4 — 1.4 — 0.8
Manufacturing 153 1.5 127 1.7 93 1.6 94 2.4 138 2.8
Construction 355 1.0 254 1.1 75 1.2 63 1.8 74 1.7
Finance 26 4.9 67 4.8 52 8.4 33 5.3 104 6.4
Service industries and
business activities 962 7.0 778 6.6 562 6.5 647 9.3 647 9.7
Agriculture, forestry
and fishing 20 0.4 19 0.3 21 0.3 25 0.6 26 0.6
Property 908 6.6 490 5.9 85 6.0 70 8.3 63 7.8
Individuals
– home mortgages 196 12.4 36 9.1 36 8.8 37 15.1 36 15.5
– other 2,527 3.4 2,235 3.0 2,054 3.4 1,826 5.9 1,513 6.3
Finance leases and
instalment credit 341 2.2 194 2.0 132 1.9 103 3.0 88 3.3
Accrued interest — 0.1 — 0.3 — 0.3 — 0.3 — 0.3
Total domestic 5,488 39.9 4,200 35.1 3,110 38.8 2,898 53.4 2,689 55.2
Foreign 8,562 60.1 4,745 64.9 2,289 61.2 442 46.6 652 44.8
Impaired book provisions 14,050 100.0 8,945 100.0 5,399 100.0 3,340 100.0 3,341 100.0
Latent book provisions 3,076 1,944 1,050 593 543
Total provisions 17,126 10,889 6,449 3,933 3,884