RBS 2009 Annual Report Download - page 81
Download and view the complete annual report
Please find page 81 of the 2009 RBS annual report below. You can navigate through the pages in the report by either clicking on the pages listed below, or by using the keyword search tool below to find specific information within the annual report.-
 1
1 -
2
-
3
-
4
-
5
-
6
-
7
-
8
-
9
-
10
-
11
-
12
-
13
-
14
-
15
-
16
-
17
-
18
-
19
-
20
-
21
-
22
-
23
-
24
-
25
-
26
-
27
-
28
-
29
-
30
-
31
-
32
-
33
-
34
-
35
-
36
-
37
-
38
-
39
-
40
-
41
-
42
-
43
-
44
-
45
-
46
-
47
-
48
-
49
-
50
-
51
-
52
-
53
-
54
-
55
-
56
-
57
-
58
-
59
-
60
-
61
-
62
-
63
-
64
-
65
-
66
-
67
-
68
-
69
-
70
-
 71
71 -
 72
72 -
 73
73 -
 74
74 -
 75
75 -
 76
76 -
 77
77 -
 78
78 -
 79
79 -
 80
80 -
 81
81 -
 82
82 -
 83
83 -
 84
84 -
 85
85 -
 86
86 -
 87
87 -
 88
88 -
 89
89 -
 90
90 -
 91
91 -
92
-
93
-
94
-
95
-
96
-
97
-
98
-
99
-
100
-
101
-
102
-
103
-
104
-
105
-
106
-
107
-
108
-
109
-
110
-
111
-
112
-
113
-
114
-
115
-
116
-
117
-
118
-
119
-
120
-
121
-
122
-
123
-
124
-
125
-
126
-
127
-
128
-
129
-
130
-
131
-
132
-
133
-
134
-
135
-
136
-
137
-
138
-
139
-
140
-
141
-
142
-
143
-
144
-
145
-
146
-
147
-
148
-
149
-
150
-
151
-
152
-
153
-
154
-
155
-
156
-
157
-
158
-
159
-
160
-
161
-
162
-
163
-
164
-
165
-
166
-
167
-
168
-
169
-
170
-
171
-
172
-
173
-
174
-
175
-
176
-
177
-
178
-
179
-
180
-
181
-
182
-
183
-
184
-
185
-
186
-
187
-
188
-
189
-
190
-
191
-
192
-
193
-
194
-
195
-
196
-
197
-
198
-
199
-
200
-
201
-
202
-
203
-
204
-
205
-
206
-
207
-
208
-
209
-
210
-
211
-
212
-
213
-
214
-
215
-
216
-
217
-
218
-
219
-
220
-
221
-
222
-
223
-
224
-
225
-
226
-
227
-
228
-
229
-
230
-
231
-
232
-
233
-
234
-
235
-
236
-
237
-
238
-
239
-
240
-
241
-
242
-
243
-
244
-
245
-
246
-
247
-
248
-
249
-
250
-
251
-
252
-
253
-
254
-
255
-
256
-
257
-
258
-
259
-
260
-
261
-
262
-
263
-
264
-
265
-
266
-
267
-
268
-
269
-
270
-
271
-
272
-
273
-
274
-
275
-
276
-
277
-
278
-
279
-
280
-
281
-
282
-
283
-
284
-
285
-
286
-
287
-
288
-
289
-
290
-
291
-
292
-
293
-
294
-
295
-
296
-
297
-
298
-
299
-
300
-
301
-
302
-
303
-
304
-
305
-
306
-
307
-
308
-
309
-
310
-
311
-
312
-
313
-
314
-
315
-
316
-
317
-
318
-
319
-
320
-
321
-
322
-
323
-
324
-
325
-
326
-
327
-
328
-
329
-
330
-
331
-
332
-
333
-
334
-
335
-
336
-
337
-
338
-
339
-
340
-
341
-
342
-
343
-
344
-
345
-
346
-
347
-
348
-
349
-
350
-
351
-
352
-
353
-
354
-
355
-
356
-
357
-
358
-
359
-
360
-
361
-
362
-
363
-
364
-
365
-
366
-
367
-
368
-
369
-
370
-
371
-
372
-
373
-
374
-
375
-
376
-
377
-
378
-
379
-
380
-
381
-
382
-
383
-
384
-
385
-
386
-
387
-
388
-
389
-
390
 |
 |

79RBS Group Annual Report and Accounts 2009
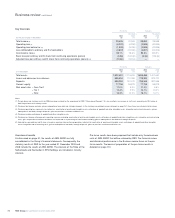
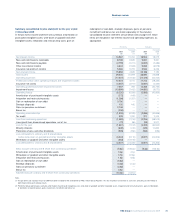
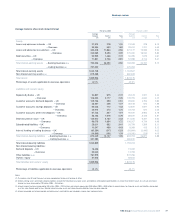
Analysis of change in net interest income – volume and rate analysis
Volume and rate variances have been calculated based on movements in average balances over the period and changes in interest rates on average
interest-earning assets and average interest-bearing liabilities. Changes due to a combination of volume and rate are allocated pro rata to volume and
rate movements.
2009 over 2008 – pro forma 2009 over 2008 – statutory
Increase/(decrease) due to changes in: Increase/(decrease) due to changes in:
Average Average Net Average Average Net
volume rate change volume rate change
£m £m £m £m £m £m
Interest-earning assets
Loans and advances to banks
UK 107 (807) (700) 110 (741) (631)
Overseas 83 (841) (758) 31 (883) (852)
Loans and advances to customers
UK 702 (7,923) (7,221) 724 (7,838) (7,114)
Overseas (1,751) (4,786) (6,537) (936) (5,618) (6,554)
Debt securities
UK 630 (843) (213) 604 (631) (27)
Overseas 646 (1,024) (378) (32) (826) (858)
Total interest receivable of the banking business
UK 1,439 (9,573) (8,134) 1,438 (9,210) (7,772)
Overseas (1,022) (6,651) (7,673) (937) (7,327) (8,264)
417 (16,224) (15,807) 501 (16,537) (16,036)
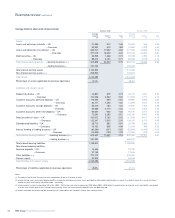
Interest-bearing liabilities
Deposits by banks
UK 588 244 832 683 442 1,125
Overseas 137 2,316 2,453 360 2,050 2,410
Customer accounts: demand deposits
UK (253) 2,488 2,235 (268) 2,528 2,260
Overseas (38) 302 264 (228) 410 182
Customer accounts: savings deposits
UK (359) 1,278 919 (369) 1,297 928
Overseas (70) 167 97 (306) 395 89
Customer accounts: other time deposits
UK 908 2,249 3,157 868 2,211 3,079
Overseas 994 814 1,808 1,151 691 1,842
Debt securities in issue
UK (651) 2,770 2,119 (691) 2,146 1,455
Overseas 414 2,666 3,080 648 3,023 3,671
Subordinated liabilities
UK 87 430 517 5 512 517
Overseas (106) 61 (45) (8) 140 132
Internal funding of trading business
UK (795) (2,333) (3,128) (795) (2,333) (3,128)
Overseas (112) (426) (538) (112) (425) (537)
Total interest payable of the banking business
UK (475) 7,126 6,651 (567) 6,803 6,236
Overseas 1,219 5,900 7,119 1,505 6,284 7,789
744 13,026 13,770 938 13,087 14,025
Movement in net interest income
UK 964 (2,447) (1,483) 871 (2,407) (1,536)
Overseas 197 (751) (554) 568 (1,043) (475)
1,161 (3,198) (2,037) 1,439 (3,450) (2,011)
Note:
(1) The analysis into UK and Overseas has been compiled on the basis of location of office.
Business review