RBS 2009 Annual Report Download - page 160
Download and view the complete annual report
Please find page 160 of the 2009 RBS annual report below. You can navigate through the pages in the report by either clicking on the pages listed below, or by using the keyword search tool below to find specific information within the annual report.-
 1
1 -
2
-
3
-
4
-
5
-
6
-
7
-
8
-
9
-
10
-
11
-
12
-
13
-
14
-
15
-
16
-
17
-
18
-
19
-
20
-
21
-
22
-
23
-
24
-
25
-
26
-
27
-
28
-
29
-
30
-
31
-
32
-
33
-
34
-
35
-
36
-
37
-
38
-
39
-
40
-
41
-
42
-
43
-
44
-
45
-
46
-
47
-
48
-
49
-
50
-
51
-
52
-
53
-
54
-
55
-
56
-
57
-
58
-
59
-
60
-
61
-
62
-
63
-
64
-
65
-
66
-
67
-
68
-
69
-
70
-
71
-
72
-
73
-
74
-
75
-
76
-
77
-
78
-
79
-
80
-
81
-
82
-
83
-
84
-
85
-
86
-
87
-
88
-
89
-
90
-
91
-
92
-
93
-
94
-
95
-
96
-
97
-
98
-
99
-
100
-
101
-
102
-
103
-
104
-
105
-
106
-
107
-
108
-
109
-
110
-
111
-
112
-
113
-
114
-
115
-
116
-
117
-
118
-
119
-
120
-
121
-
122
-
123
-
124
-
125
-
126
-
127
-
128
-
129
-
130
-
131
-
132
-
133
-
134
-
135
-
136
-
137
-
138
-
139
-
140
-
141
-
142
-
143
-
144
-
145
-
146
-
147
-
148
-
149
-
 150
150 -
 151
151 -
 152
152 -
 153
153 -
 154
154 -
 155
155 -
 156
156 -
 157
157 -
 158
158 -
 159
159 -
 160
160 -
 161
161 -
 162
162 -
 163
163 -
 164
164 -
 165
165 -
 166
166 -
 167
167 -
 168
168 -
 169
169 -
 170
170 -
171
-
172
-
173
-
174
-
175
-
176
-
177
-
178
-
179
-
180
-
181
-
182
-
183
-
184
-
185
-
186
-
187
-
188
-
189
-
190
-
191
-
192
-
193
-
194
-
195
-
196
-
197
-
198
-
199
-
200
-
201
-
202
-
203
-
204
-
205
-
206
-
207
-
208
-
209
-
210
-
211
-
212
-
213
-
214
-
215
-
216
-
217
-
218
-
219
-
220
-
221
-
222
-
223
-
224
-
225
-
226
-
227
-
228
-
229
-
230
-
231
-
232
-
233
-
234
-
235
-
236
-
237
-
238
-
239
-
240
-
241
-
242
-
243
-
244
-
245
-
246
-
247
-
248
-
249
-
250
-
251
-
252
-
253
-
254
-
255
-
256
-
257
-
258
-
259
-
260
-
261
-
262
-
263
-
264
-
265
-
266
-
267
-
268
-
269
-
270
-
271
-
272
-
273
-
274
-
275
-
276
-
277
-
278
-
279
-
280
-
281
-
282
-
283
-
284
-
285
-
286
-
287
-
288
-
289
-
290
-
291
-
292
-
293
-
294
-
295
-
296
-
297
-
298
-
299
-
300
-
301
-
302
-
303
-
304
-
305
-
306
-
307
-
308
-
309
-
310
-
311
-
312
-
313
-
314
-
315
-
316
-
317
-
318
-
319
-
320
-
321
-
322
-
323
-
324
-
325
-
326
-
327
-
328
-
329
-
330
-
331
-
332
-
333
-
334
-
335
-
336
-
337
-
338
-
339
-
340
-
341
-
342
-
343
-
344
-
345
-
346
-
347
-
348
-
349
-
350
-
351
-
352
-
353
-
354
-
355
-
356
-
357
-
358
-
359
-
360
-
361
-
362
-
363
-
364
-
365
-
366
-
367
-
368
-
369
-
370
-
371
-
372
-
373
-
374
-
375
-
376
-
377
-
378
-
379
-
380
-
381
-
382
-
383
-
384
-
385
-
386
-
387
-
388
-
389
-
390
 |
 |

Business review continued
RBS Group Annual Report and Accounts 2009158
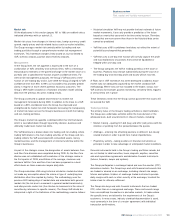
Funding and liquidity risk continued
Funding profile continued
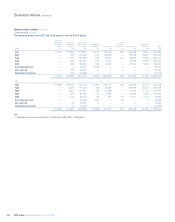
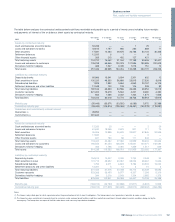
The tables on the previous page show the timing of cash inflows and
outflows to settle financial assets and liabilities. They have been
prepared on the following basis:
Financial assets have been reflected in the time band of the latest date
on which they could be repaid, unless earlier repayment can be
demanded by the Group. Financial liabilities are included at the earliest
date on which the counterparty can require repayment regardless of
whether or not such early repayment results in a penalty. If the
repayment of a financial asset or liability is triggered by, or is subject to,
specific criteria, such as market price hurdles being reached, the asset
is included in the latest date on which it can repay regardless of early
repayment, the liability is included at the earliest possible date that the
conditions could be fulfilled without considering the probability of the
conditions being met.
For example, if a structured note is automatically prepaid when an
equity index exceeds a certain level, the cash outflow will be included in
the less than three months period whatever the level of the index at the
year end. The settlement date of debt securities in issue, issued by
certain securitisation vehicles consolidated by the Group, depends on
when cash-flows are received from the securitised assets. Where these
assets are prepayable, the timing of the cash-outflow relating to
securities assumes that each asset will be prepaid at the earliest
possible date. As the repayment of assets and liabilities are linked, the
repayment of assets in securitisations are shown on the earliest date
that the asset can be prepaid as this is the basis used for liabilities.
Assets and liabilities with a contractual maturity of greater than twenty
years – the principal amounts of financial assets and liabilities that are
repayable after twenty years or where the counterparty has no right to
repayment of the principal are excluded from the table, as are interest
payments after twenty years.
Held-for-trading assets and liabilities – held-for-trading assets and
liabilities amounting to £651 billion (assets) and £568 billion (liabilities)
(2008 – £1,227 billion assets, £1,147 billion liabilities) have been
excluded from the table in view of their short term nature.
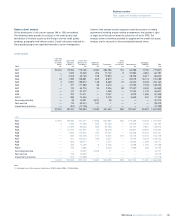
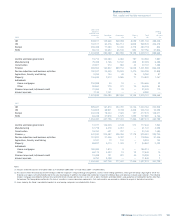
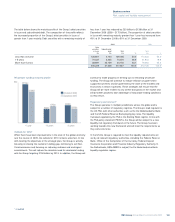
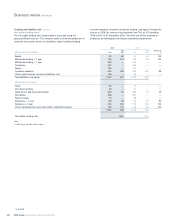
Wholesale funding breakdown
The table below shows the composition of the sources of wholesale
funding of the Group before RFS minority interest. The Group has
implemented its funding strategy of reducing its reliance on short-term
wholesale funding. Deposits by banks have decreased by £63 billion to
£116 billion; comprising 14.3% of total funding sources at 31 December
2009, down from 18.8% at 31 December 2008. Short-term debt
securities such as commercial paper and certificates of deposits in
issue have also reduced by £41 billion to £103 billion at 31 December
2009 from £144 billion at 31 December 2008.
2009 2008
£m % £m %
Deposits by banks (1) 115,642 14.3 178,943 18.8
Debt securities in issue:
–Commercial paper 44,307 5.5 69,891 7.3
– Certificates of deposits 58,195 7.2 73,925 7.8
– Medium term notes and other bonds 125,800 15.6 108,529 11.4
– Securitisations 18,027 2.2 17,113 1.8
246,329 30.5 269,458 28.3
Subordinated debt 31,538 3.9 43,678 4.6
Total wholesale funding 393,509 48.7 492,079 51.7
Customer deposits (1) 414,251 51.3 460,318 48.3
807,760 100.0 952,397 100.0
Note:
(1) Excluding repurchase agreements and stock lending.
The total level of the Group’s wholesale funding has reduced year on year by £99 billion with the majority of the reduction attributable to a reduced
reliance on inter-bank funding.