RBS 2009 Annual Report Download - page 138
Download and view the complete annual report
Please find page 138 of the 2009 RBS annual report below. You can navigate through the pages in the report by either clicking on the pages listed below, or by using the keyword search tool below to find specific information within the annual report.-
 1
1 -
2
-
3
-
4
-
5
-
6
-
7
-
8
-
9
-
10
-
11
-
12
-
13
-
14
-
15
-
16
-
17
-
18
-
19
-
20
-
21
-
22
-
23
-
24
-
25
-
26
-
27
-
28
-
29
-
30
-
31
-
32
-
33
-
34
-
35
-
36
-
37
-
38
-
39
-
40
-
41
-
42
-
43
-
44
-
45
-
46
-
47
-
48
-
49
-
50
-
51
-
52
-
53
-
54
-
55
-
56
-
57
-
58
-
59
-
60
-
61
-
62
-
63
-
64
-
65
-
66
-
67
-
68
-
69
-
70
-
71
-
72
-
73
-
74
-
75
-
76
-
77
-
78
-
79
-
80
-
81
-
82
-
83
-
84
-
85
-
86
-
87
-
88
-
89
-
90
-
91
-
92
-
93
-
94
-
95
-
96
-
97
-
98
-
99
-
100
-
101
-
102
-
103
-
104
-
105
-
106
-
107
-
108
-
109
-
110
-
111
-
112
-
113
-
114
-
115
-
116
-
117
-
118
-
119
-
120
-
121
-
122
-
123
-
124
-
125
-
126
-
127
-
 128
128 -
 129
129 -
 130
130 -
 131
131 -
 132
132 -
 133
133 -
 134
134 -
 135
135 -
 136
136 -
 137
137 -
 138
138 -
 139
139 -
 140
140 -
 141
141 -
 142
142 -
 143
143 -
 144
144 -
 145
145 -
 146
146 -
 147
147 -
 148
148 -
149
-
150
-
151
-
152
-
153
-
154
-
155
-
156
-
157
-
158
-
159
-
160
-
161
-
162
-
163
-
164
-
165
-
166
-
167
-
168
-
169
-
170
-
171
-
172
-
173
-
174
-
175
-
176
-
177
-
178
-
179
-
180
-
181
-
182
-
183
-
184
-
185
-
186
-
187
-
188
-
189
-
190
-
191
-
192
-
193
-
194
-
195
-
196
-
197
-
198
-
199
-
200
-
201
-
202
-
203
-
204
-
205
-
206
-
207
-
208
-
209
-
210
-
211
-
212
-
213
-
214
-
215
-
216
-
217
-
218
-
219
-
220
-
221
-
222
-
223
-
224
-
225
-
226
-
227
-
228
-
229
-
230
-
231
-
232
-
233
-
234
-
235
-
236
-
237
-
238
-
239
-
240
-
241
-
242
-
243
-
244
-
245
-
246
-
247
-
248
-
249
-
250
-
251
-
252
-
253
-
254
-
255
-
256
-
257
-
258
-
259
-
260
-
261
-
262
-
263
-
264
-
265
-
266
-
267
-
268
-
269
-
270
-
271
-
272
-
273
-
274
-
275
-
276
-
277
-
278
-
279
-
280
-
281
-
282
-
283
-
284
-
285
-
286
-
287
-
288
-
289
-
290
-
291
-
292
-
293
-
294
-
295
-
296
-
297
-
298
-
299
-
300
-
301
-
302
-
303
-
304
-
305
-
306
-
307
-
308
-
309
-
310
-
311
-
312
-
313
-
314
-
315
-
316
-
317
-
318
-
319
-
320
-
321
-
322
-
323
-
324
-
325
-
326
-
327
-
328
-
329
-
330
-
331
-
332
-
333
-
334
-
335
-
336
-
337
-
338
-
339
-
340
-
341
-
342
-
343
-
344
-
345
-
346
-
347
-
348
-
349
-
350
-
351
-
352
-
353
-
354
-
355
-
356
-
357
-
358
-
359
-
360
-
361
-
362
-
363
-
364
-
365
-
366
-
367
-
368
-
369
-
370
-
371
-
372
-
373
-
374
-
375
-
376
-
377
-
378
-
379
-
380
-
381
-
382
-
383
-
384
-
385
-
386
-
387
-
388
-
389
-
390
 |
 |

Business review continued
RBS Group Annual Report and Accounts 2009136
* unaudited
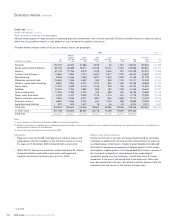
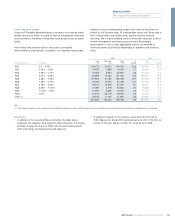
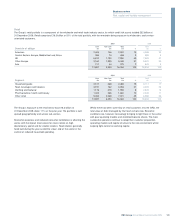
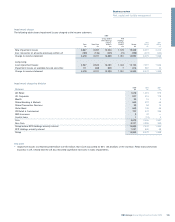
Personal lending
The Group’s personal lending portfolio includes credit cards, unsecured loans, auto finance and overdrafts. The majority of personal lending
exposures exist in the UK and the US. New defaults as a proportion of average loans and receivables were:
2009 2008
Impairment Impairment
Average charge as a % Average charge as a %
loans and of loans and loans and of loans and
receivables receivables receivables receivables
Personal lending £m % £m %
UK Retail cards (1) 6,101 8.7 6,617 6.4
UK Retail loans (1) 12,062 5.9 13,545 3.3
$m % $m %
Citizens cards (2) 2,286 8.9 2,275 4.9
Citizens auto loans (2) 9,759 1.2 11,386 1.1
Notes:
(1) The charge for UK Retail assets refers to impairment on assets in the year.
(2) The charge for Citizens assets refers to charge offs in the year, net of recoveries realised in the year.
Credit risk continued
Credit risk assets*continued
The SBO portfolio consists of purchased pools of home equity loans
and lines whose current LTV (95.6% on a weighted average basis at 31
December 2009) and geographic profiles (74% outside of Citizen’s
footprint states and a 30% concentration in California, Arizona and
Nevada) have, in the current economic climate, resulted in an
annualised write-off rate of 10.7% in 2009. The SBO book has been
closed to new purchases since the third quarter of 2007 and is in run-
off, with exposure down from $7.0 billion at 31 December 2008 to $5.5
billion at 31 December 2009.
The current weighted average LTV of the real estate portfolio rose
slightly during the year to 72.0% at 31 December 2009 (67.5%
excluding the SBO portfolio), driven by significant price declines
throughout the US. Based on the latest Case-Shiller forecast for the US
market, economists still anticipate significant decreases in the first half
of 2010 with improvements expected in late 2010 or early 2011.
The arrears rate increased significantly from 0.9% at 31 December 2008
to 1.5% at 31 December 2009. In part, this reflects the contraction of
the portfolio caused by fewer new loans added, Citizen choosing to
exercise its option to sell certain mortgages to the secondary market
under long-term agreements, and higher run-off or pay-down rates
across all residential products.
The UK personal lending portfolio, of which 97% is in Core businesses,
comprises credit cards, unsecured loans and overdrafts and totalled £20.3
billion at 31 December 2009, a decrease of 10% from 31 December 2008
(£22.5 billion) due to a general market trend of customers repaying debt
on credit cards and loan balances and a reduction in new lending.
Risk appetite continues to be actively managed across all unsecured
products, reflecting the challenging economic environment. Support
continues for customers in financial difficulties through breathing space
initiatives on all unsecured products, whereby a thirty day period allows
customers to work with a not-for-profit debt advice agency to establish a
debt repayment plan. During this time the Group suspends collection
activity. A further extension of thirty days can be granted if progress is
made and discussions are continuing. Investment in collection and
recovery processes continues, addressing both continued support for our
customers and the management of impairments.
Default rates on both cards and loans in the UK increased in 2009, driven
by the deterioration in the economic environment and, to a lesser extent,
the reduction in total balances. Default rates are still sensitive to economic
developments, notably unemployment rates.
The Citizens credit card portfolio totalled US$2.3 billion, at
31 December 2009. Core assets comprised 58% of the portfolio.
The Citizens cards business adopts conservative risk strategies compared
to the US market as illustrated by the business generally performing better
than industry benchmarks (provided by VISA). The latest available metrics
(December 2009) show the rate for 60+ days delinquency as a percentage
of total outstandings at 4.4% (compared to an industry figure of 4.7%) and
net contractual charge-offs as a percentage of total outstandings at 7.1%
(compared to an industry figure of 7.4%).
For new customers, lending criteria have been tightened and initial
credit lines reduced. Existing customers are regularly monitored for
changes in asset quality and behaviour and, where appropriate,
proactive measures are taken to limit or reduce credit exposure.
Citizens is a leading provider of retail auto financing to US consumers
through a network of 3,500 auto dealers located in 23 US states. It
maintains a conservative, prime indirect auto lending credit programme
with loss rates that have historically been below national averages.
Current outstanding retail auto loan balances totalled $8.8 billion as of
31 December 2009, when the 30-day delinquency rate stood at 2.6%.
This compares to data reported by the American Bankers’ Association
(latest available is at 30 September 2009) showing the nationwide
indirect auto lending delinquency rate at 2.8%. Citizens recently shifted
its focus on auto financing, moving from a nationwide emphasis to its
regional lending footprint. This, together with enhanced collection
activities, has resulted in better than expected loss results. Total portfolio
losses fell from $129.6 million in 2008 to $120.6 million in 2009.