RBS 2009 Annual Report Download - page 347
Download and view the complete annual report
Please find page 347 of the 2009 RBS annual report below. You can navigate through the pages in the report by either clicking on the pages listed below, or by using the keyword search tool below to find specific information within the annual report.-
 1
1 -
2
-
3
-
4
-
5
-
6
-
7
-
8
-
9
-
10
-
11
-
12
-
13
-
14
-
15
-
16
-
17
-
18
-
19
-
20
-
21
-
22
-
23
-
24
-
25
-
26
-
27
-
28
-
29
-
30
-
31
-
32
-
33
-
34
-
35
-
36
-
37
-
38
-
39
-
40
-
41
-
42
-
43
-
44
-
45
-
46
-
47
-
48
-
49
-
50
-
51
-
52
-
53
-
54
-
55
-
56
-
57
-
58
-
59
-
60
-
61
-
62
-
63
-
64
-
65
-
66
-
67
-
68
-
69
-
70
-
71
-
72
-
73
-
74
-
75
-
76
-
77
-
78
-
79
-
80
-
81
-
82
-
83
-
84
-
85
-
86
-
87
-
88
-
89
-
90
-
91
-
92
-
93
-
94
-
95
-
96
-
97
-
98
-
99
-
100
-
101
-
102
-
103
-
104
-
105
-
106
-
107
-
108
-
109
-
110
-
111
-
112
-
113
-
114
-
115
-
116
-
117
-
118
-
119
-
120
-
121
-
122
-
123
-
124
-
125
-
126
-
127
-
128
-
129
-
130
-
131
-
132
-
133
-
134
-
135
-
136
-
137
-
138
-
139
-
140
-
141
-
142
-
143
-
144
-
145
-
146
-
147
-
148
-
149
-
150
-
151
-
152
-
153
-
154
-
155
-
156
-
157
-
158
-
159
-
160
-
161
-
162
-
163
-
164
-
165
-
166
-
167
-
168
-
169
-
170
-
171
-
172
-
173
-
174
-
175
-
176
-
177
-
178
-
179
-
180
-
181
-
182
-
183
-
184
-
185
-
186
-
187
-
188
-
189
-
190
-
191
-
192
-
193
-
194
-
195
-
196
-
197
-
198
-
199
-
200
-
201
-
202
-
203
-
204
-
205
-
206
-
207
-
208
-
209
-
210
-
211
-
212
-
213
-
214
-
215
-
216
-
217
-
218
-
219
-
220
-
221
-
222
-
223
-
224
-
225
-
226
-
227
-
228
-
229
-
230
-
231
-
232
-
233
-
234
-
235
-
236
-
237
-
238
-
239
-
240
-
241
-
242
-
243
-
244
-
245
-
246
-
247
-
248
-
249
-
250
-
251
-
252
-
253
-
254
-
255
-
256
-
257
-
258
-
259
-
260
-
261
-
262
-
263
-
264
-
265
-
266
-
267
-
268
-
269
-
270
-
271
-
272
-
273
-
274
-
275
-
276
-
277
-
278
-
279
-
280
-
281
-
282
-
283
-
284
-
285
-
286
-
287
-
288
-
289
-
290
-
291
-
292
-
293
-
294
-
295
-
296
-
297
-
298
-
299
-
300
-
301
-
302
-
303
-
304
-
305
-
306
-
307
-
308
-
309
-
310
-
311
-
312
-
313
-
314
-
315
-
316
-
317
-
318
-
319
-
320
-
321
-
322
-
323
-
324
-
325
-
326
-
327
-
328
-
329
-
330
-
331
-
332
-
333
-
334
-
335
-
336
-
 337
337 -
 338
338 -
 339
339 -
 340
340 -
 341
341 -
 342
342 -
 343
343 -
 344
344 -
 345
345 -
 346
346 -
 347
347 -
 348
348 -
 349
349 -
 350
350 -
 351
351 -
 352
352 -
 353
353 -
 354
354 -
 355
355 -
 356
356 -
 357
357 -
358
-
359
-
360
-
361
-
362
-
363
-
364
-
365
-
366
-
367
-
368
-
369
-
370
-
371
-
372
-
373
-
374
-
375
-
376
-
377
-
378
-
379
-
380
-
381
-
382
-
383
-
384
-
385
-
386
-
387
-
388
-
389
-
390
 |
 |

345RBS Group Annual Report and Accounts 2009
Financial statements
Notes on the accounts
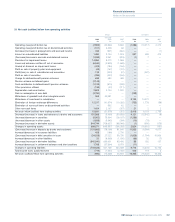
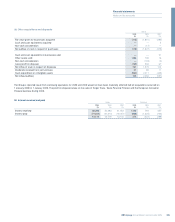
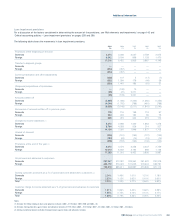
(b) Geographical segments
The geographical analyses in the tables below have been compiled on the basis of location of office where the transactions are recorded.
Group
Rest of
UK USA Europe the World Total
2009 £m £m £m £m £m
Total revenue 28,490 10,783 16,102 3,732 59,107
Net interest income 7,824 2,974 4,348 1,358 16,504
Net fees and commissions 3,670 1,589 1,297 453 7,009
Income from trading activities 106 2,470 636 669 3,881
Other operating income/(loss) 6,067 119 (102) (332) 5,752
Insurance premium income (net of reinsurers’ share) 4,872 – 672 – 5,544
Total income 22,539 7,152 6,851 2,148 38,690
Operating profit/(loss) before tax 1,856 97 (3,526) (1,022) (2,595)
Total assets 949,765 338,649 320,008 88,064 1,696,486
Total liabilities 873,716 322,698 321,133 84,308 1,601,855
Net assets attributable to equity owners and minority interests 76,049 15,951 (1,125) 3,756 94,631
Contingent liabilities and commitments 175,392 93,694 65,026 17,549 351,661
Cost to acquire property, plant and equipment and intangible assets 1,974 390 3,252 94 5,710
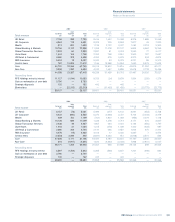
2008
Total revenue 23,748 8,518 21,112 6,023 59,401
Net interest income 9,853 2,790 5,018 1,014 18,675
Net fees and commissions 3,728 1,492 1,648 577 7,445
(Loss)/income from trading activities (7,103) (1,604) (552) 782 (8,477)
Other operating income/(loss) 2,337 49 (528) 41 1,899
Insurance premium income (net of reinsurers’ share) 5,190 — 1,136 — 6,326
Total income 14,005 2,727 6,722 2,414 25,868
Operating (loss)/profit before tax (8,158) (5,809) (26,883) 14 (40,836)
Total assets 1,304,714 607,511 368,290 121,137 2,401,652
Total liabilities 1,253,814 592,272 361,590 113,478 2,321,154
Net assets attributable to equity owners and minority interests 50,900 15,239 6,700 7,659 80,498
Contingent liabilities and commitments 200,763 131,435 79,941 21,122 433,261
Cost to acquire property, plant and equipment and intangible assets 3,415 445 2,204 186 6,250