RBS 2009 Annual Report Download - page 150
Download and view the complete annual report
Please find page 150 of the 2009 RBS annual report below. You can navigate through the pages in the report by either clicking on the pages listed below, or by using the keyword search tool below to find specific information within the annual report.-
 1
1 -
2
-
3
-
4
-
5
-
6
-
7
-
8
-
9
-
10
-
11
-
12
-
13
-
14
-
15
-
16
-
17
-
18
-
19
-
20
-
21
-
22
-
23
-
24
-
25
-
26
-
27
-
28
-
29
-
30
-
31
-
32
-
33
-
34
-
35
-
36
-
37
-
38
-
39
-
40
-
41
-
42
-
43
-
44
-
45
-
46
-
47
-
48
-
49
-
50
-
51
-
52
-
53
-
54
-
55
-
56
-
57
-
58
-
59
-
60
-
61
-
62
-
63
-
64
-
65
-
66
-
67
-
68
-
69
-
70
-
71
-
72
-
73
-
74
-
75
-
76
-
77
-
78
-
79
-
80
-
81
-
82
-
83
-
84
-
85
-
86
-
87
-
88
-
89
-
90
-
91
-
92
-
93
-
94
-
95
-
96
-
97
-
98
-
99
-
100
-
101
-
102
-
103
-
104
-
105
-
106
-
107
-
108
-
109
-
110
-
111
-
112
-
113
-
114
-
115
-
116
-
117
-
118
-
119
-
120
-
121
-
122
-
123
-
124
-
125
-
126
-
127
-
128
-
129
-
130
-
131
-
132
-
133
-
134
-
135
-
136
-
137
-
138
-
139
-
 140
140 -
 141
141 -
 142
142 -
 143
143 -
 144
144 -
 145
145 -
 146
146 -
 147
147 -
 148
148 -
 149
149 -
 150
150 -
 151
151 -
 152
152 -
 153
153 -
 154
154 -
 155
155 -
 156
156 -
 157
157 -
 158
158 -
 159
159 -
 160
160 -
161
-
162
-
163
-
164
-
165
-
166
-
167
-
168
-
169
-
170
-
171
-
172
-
173
-
174
-
175
-
176
-
177
-
178
-
179
-
180
-
181
-
182
-
183
-
184
-
185
-
186
-
187
-
188
-
189
-
190
-
191
-
192
-
193
-
194
-
195
-
196
-
197
-
198
-
199
-
200
-
201
-
202
-
203
-
204
-
205
-
206
-
207
-
208
-
209
-
210
-
211
-
212
-
213
-
214
-
215
-
216
-
217
-
218
-
219
-
220
-
221
-
222
-
223
-
224
-
225
-
226
-
227
-
228
-
229
-
230
-
231
-
232
-
233
-
234
-
235
-
236
-
237
-
238
-
239
-
240
-
241
-
242
-
243
-
244
-
245
-
246
-
247
-
248
-
249
-
250
-
251
-
252
-
253
-
254
-
255
-
256
-
257
-
258
-
259
-
260
-
261
-
262
-
263
-
264
-
265
-
266
-
267
-
268
-
269
-
270
-
271
-
272
-
273
-
274
-
275
-
276
-
277
-
278
-
279
-
280
-
281
-
282
-
283
-
284
-
285
-
286
-
287
-
288
-
289
-
290
-
291
-
292
-
293
-
294
-
295
-
296
-
297
-
298
-
299
-
300
-
301
-
302
-
303
-
304
-
305
-
306
-
307
-
308
-
309
-
310
-
311
-
312
-
313
-
314
-
315
-
316
-
317
-
318
-
319
-
320
-
321
-
322
-
323
-
324
-
325
-
326
-
327
-
328
-
329
-
330
-
331
-
332
-
333
-
334
-
335
-
336
-
337
-
338
-
339
-
340
-
341
-
342
-
343
-
344
-
345
-
346
-
347
-
348
-
349
-
350
-
351
-
352
-
353
-
354
-
355
-
356
-
357
-
358
-
359
-
360
-
361
-
362
-
363
-
364
-
365
-
366
-
367
-
368
-
369
-
370
-
371
-
372
-
373
-
374
-
375
-
376
-
377
-
378
-
379
-
380
-
381
-
382
-
383
-
384
-
385
-
386
-
387
-
388
-
389
-
390
 |
 |

Business review continued
RBS Group Annual Report and Accounts 2009148
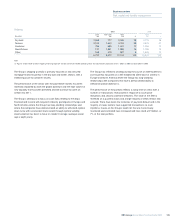
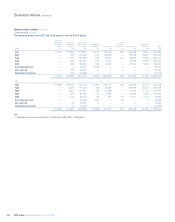
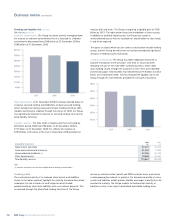
Analysis of AFS impairment charge
The following table analyses the AFS impairment charge.
2009 2008 2007
Group before Group before Group before
RFS Holdings RFS Holdings RFS Holdings
minority minority minority
interest Group interest Group interest Group
£m £m £m £m £m £m
Debt securities 601 601 851 878 20 20
Equity securities 208 215 103 103 2 2
Total 809 816 954 981 22 22
Charge as a % of AFS assets 0.6% 0.6% 0.7% 0.8% — —
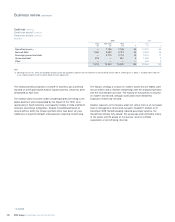
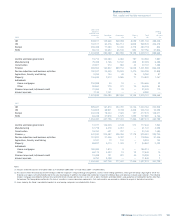
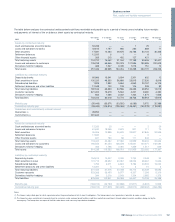
Credit risk continued
Movement in loan impairment provisions continued
The movement in provisions balance by division is shown in the table below.
RFS
UK Global Global US Holdings
UK Corporate Banking Transaction Ulster Retail & minority
Retail Banking Wealth & Markets Services Bank Commercial Non-Core interest 2009 2008 2007
£m £m £m £m £m £m £m £m £m £m £m £m
At 1 January 2,086 696 34 621 43 491 298 5,182 1,565 11,016 6,452 3,935
Transfer to disposal groups — — — (16) — — — (305) (3) (324) (767) —
Currency translation
and other adjustments 67 5 1 365 128 (109) (34) (851) (102) (530) 1,441 137
Acquisition of subsidiaries ——————————— 2,221
Disposal of subsidiaries — — — (62) — — — (3) — (65) (178) —
Net increase in provisions of
discontinued operations ———————————46
Amounts written-off (1,150) (352) (12) (169) (23) (34) (546) (4,192) (461) (6,939) (3,148) (2,011)
Recoveries of amounts
previously written-off 97 20 — 11 2 1 58 136 74 399 319 342
Charged to the income
statement (1) 1,679 923 33 542 39 649 702 8,523 1,044 14,134 7,091 1,946
Unwind of discount (102) (21) (1) (3) — (36) — (238) (7) (408) (194) (164)
At 31 December (2) 2,677 1,271 55 1,289 189 962 478 8,252 2,110 17,283 11,016 6,452
Key points
•The provision charge for 2009 was approximately double the previous year.
•Wholesale portfolios continue to drive the trend in provisions, with a notable concentration in the property sector.