RBS 2009 Annual Report Download - page 139
Download and view the complete annual report
Please find page 139 of the 2009 RBS annual report below. You can navigate through the pages in the report by either clicking on the pages listed below, or by using the keyword search tool below to find specific information within the annual report.-
 1
1 -
2
-
3
-
4
-
5
-
6
-
7
-
8
-
9
-
10
-
11
-
12
-
13
-
14
-
15
-
16
-
17
-
18
-
19
-
20
-
21
-
22
-
23
-
24
-
25
-
26
-
27
-
28
-
29
-
30
-
31
-
32
-
33
-
34
-
35
-
36
-
37
-
38
-
39
-
40
-
41
-
42
-
43
-
44
-
45
-
46
-
47
-
48
-
49
-
50
-
51
-
52
-
53
-
54
-
55
-
56
-
57
-
58
-
59
-
60
-
61
-
62
-
63
-
64
-
65
-
66
-
67
-
68
-
69
-
70
-
71
-
72
-
73
-
74
-
75
-
76
-
77
-
78
-
79
-
80
-
81
-
82
-
83
-
84
-
85
-
86
-
87
-
88
-
89
-
90
-
91
-
92
-
93
-
94
-
95
-
96
-
97
-
98
-
99
-
100
-
101
-
102
-
103
-
104
-
105
-
106
-
107
-
108
-
109
-
110
-
111
-
112
-
113
-
114
-
115
-
116
-
117
-
118
-
119
-
120
-
121
-
122
-
123
-
124
-
125
-
126
-
127
-
128
-
 129
129 -
 130
130 -
 131
131 -
 132
132 -
 133
133 -
 134
134 -
 135
135 -
 136
136 -
 137
137 -
 138
138 -
 139
139 -
 140
140 -
 141
141 -
 142
142 -
 143
143 -
 144
144 -
 145
145 -
 146
146 -
 147
147 -
 148
148 -
 149
149 -
150
-
151
-
152
-
153
-
154
-
155
-
156
-
157
-
158
-
159
-
160
-
161
-
162
-
163
-
164
-
165
-
166
-
167
-
168
-
169
-
170
-
171
-
172
-
173
-
174
-
175
-
176
-
177
-
178
-
179
-
180
-
181
-
182
-
183
-
184
-
185
-
186
-
187
-
188
-
189
-
190
-
191
-
192
-
193
-
194
-
195
-
196
-
197
-
198
-
199
-
200
-
201
-
202
-
203
-
204
-
205
-
206
-
207
-
208
-
209
-
210
-
211
-
212
-
213
-
214
-
215
-
216
-
217
-
218
-
219
-
220
-
221
-
222
-
223
-
224
-
225
-
226
-
227
-
228
-
229
-
230
-
231
-
232
-
233
-
234
-
235
-
236
-
237
-
238
-
239
-
240
-
241
-
242
-
243
-
244
-
245
-
246
-
247
-
248
-
249
-
250
-
251
-
252
-
253
-
254
-
255
-
256
-
257
-
258
-
259
-
260
-
261
-
262
-
263
-
264
-
265
-
266
-
267
-
268
-
269
-
270
-
271
-
272
-
273
-
274
-
275
-
276
-
277
-
278
-
279
-
280
-
281
-
282
-
283
-
284
-
285
-
286
-
287
-
288
-
289
-
290
-
291
-
292
-
293
-
294
-
295
-
296
-
297
-
298
-
299
-
300
-
301
-
302
-
303
-
304
-
305
-
306
-
307
-
308
-
309
-
310
-
311
-
312
-
313
-
314
-
315
-
316
-
317
-
318
-
319
-
320
-
321
-
322
-
323
-
324
-
325
-
326
-
327
-
328
-
329
-
330
-
331
-
332
-
333
-
334
-
335
-
336
-
337
-
338
-
339
-
340
-
341
-
342
-
343
-
344
-
345
-
346
-
347
-
348
-
349
-
350
-
351
-
352
-
353
-
354
-
355
-
356
-
357
-
358
-
359
-
360
-
361
-
362
-
363
-
364
-
365
-
366
-
367
-
368
-
369
-
370
-
371
-
372
-
373
-
374
-
375
-
376
-
377
-
378
-
379
-
380
-
381
-
382
-
383
-
384
-
385
-
386
-
387
-
388
-
389
-
390
 |
 |

Business review
Risk, capital and liquidity management
137RBS Group Annual Report and Accounts 2009
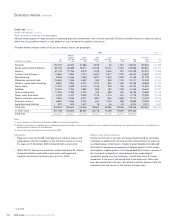
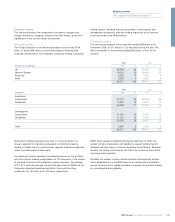
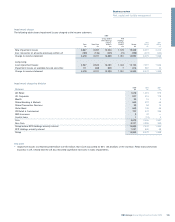
2009 2008
Domicile of obligor £m % £m %
UK 55,904 66 55,986 58
Western Europe 19,212 22 28,439 30
Americas 6,520 8 7,996 8
RoW 3,575 4 4,250 4
85,211 100 96,671 100
2009 2008
Segment £m % £m %
Investment:
Commercial 47,371 56 54,028 56
Residential 12,921 15 13,937 14
60,292 71 67,965 70
Development:
Commercial 11,081 13 11,843 12
Residential 11,271 13 12,154 13
22,352 26 23,997 25
Other 2,567 3 4,709 5
85,211 100 96,671 100
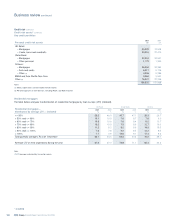
Corporate sectors
This section discusses the components of property, transport and
storage (automotive, shipping, aviation) and retail sectors, given their
significance in the current market environment.
Wholesale property
The Group's exposure to the wholesale property sector totals £104
billion, of which £85 billion is commercial property financing and
analysed in detail below. The remainder comprises lending to property
related sectors, including housing associations, estate agents and
management companies, and non-lending exposures on off balance
sheet instruments and FX/derivatives.
Commercial property
The commercial property finance portfolio totalled £85 billion at 31
December 2009, an £11 billion or 12% decrease during the year. The
Non-Core portion of the portfolio totalled £38 billion, or 44% of the
portfolio.
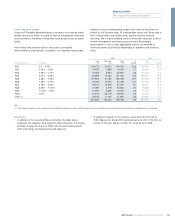
Speculative lending represents less than 1% of the portfolio. The
Group’s appetite for originating speculative commercial property
lending is limited and any such business requires exceptional approval
under the credit approval framework.
The decrease in asset valuations has placed pressure on the portfolio
with more clients seeking renegotiations of LTV covenants in the context
of granting structural enhancements or equity injections. The average
LTV is 91% while the average interest coverage ratios for GBM and UK
Corporate originated investment portfolios (Core and Non-Core
combined) are 1.60 times and 1.64 times, respectively.
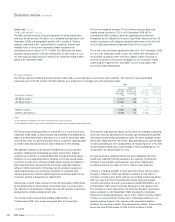
Whilst asset valuations stabilised during the latter part of 2009, the
outlook remains challenging, with liquidity to support refinancing still
reduced and high levels of concern regarding tenant failures. Wherever
feasible, the Group works closely with clients to restructure loans while
achieving mutual benefits.
Portfolios are subject to close monitoring within the originating division
and a dedicated unit in the GRG focuses on commercial real estate to
ensure that expertise is readily available to manage this portfolio actively
on a coordinated basis globally.