RBS 2009 Annual Report Download - page 352
Download and view the complete annual report
Please find page 352 of the 2009 RBS annual report below. You can navigate through the pages in the report by either clicking on the pages listed below, or by using the keyword search tool below to find specific information within the annual report.-
 1
1 -
2
-
3
-
4
-
5
-
6
-
7
-
8
-
9
-
10
-
11
-
12
-
13
-
14
-
15
-
16
-
17
-
18
-
19
-
20
-
21
-
22
-
23
-
24
-
25
-
26
-
27
-
28
-
29
-
30
-
31
-
32
-
33
-
34
-
35
-
36
-
37
-
38
-
39
-
40
-
41
-
42
-
43
-
44
-
45
-
46
-
47
-
48
-
49
-
50
-
51
-
52
-
53
-
54
-
55
-
56
-
57
-
58
-
59
-
60
-
61
-
62
-
63
-
64
-
65
-
66
-
67
-
68
-
69
-
70
-
71
-
72
-
73
-
74
-
75
-
76
-
77
-
78
-
79
-
80
-
81
-
82
-
83
-
84
-
85
-
86
-
87
-
88
-
89
-
90
-
91
-
92
-
93
-
94
-
95
-
96
-
97
-
98
-
99
-
100
-
101
-
102
-
103
-
104
-
105
-
106
-
107
-
108
-
109
-
110
-
111
-
112
-
113
-
114
-
115
-
116
-
117
-
118
-
119
-
120
-
121
-
122
-
123
-
124
-
125
-
126
-
127
-
128
-
129
-
130
-
131
-
132
-
133
-
134
-
135
-
136
-
137
-
138
-
139
-
140
-
141
-
142
-
143
-
144
-
145
-
146
-
147
-
148
-
149
-
150
-
151
-
152
-
153
-
154
-
155
-
156
-
157
-
158
-
159
-
160
-
161
-
162
-
163
-
164
-
165
-
166
-
167
-
168
-
169
-
170
-
171
-
172
-
173
-
174
-
175
-
176
-
177
-
178
-
179
-
180
-
181
-
182
-
183
-
184
-
185
-
186
-
187
-
188
-
189
-
190
-
191
-
192
-
193
-
194
-
195
-
196
-
197
-
198
-
199
-
200
-
201
-
202
-
203
-
204
-
205
-
206
-
207
-
208
-
209
-
210
-
211
-
212
-
213
-
214
-
215
-
216
-
217
-
218
-
219
-
220
-
221
-
222
-
223
-
224
-
225
-
226
-
227
-
228
-
229
-
230
-
231
-
232
-
233
-
234
-
235
-
236
-
237
-
238
-
239
-
240
-
241
-
242
-
243
-
244
-
245
-
246
-
247
-
248
-
249
-
250
-
251
-
252
-
253
-
254
-
255
-
256
-
257
-
258
-
259
-
260
-
261
-
262
-
263
-
264
-
265
-
266
-
267
-
268
-
269
-
270
-
271
-
272
-
273
-
274
-
275
-
276
-
277
-
278
-
279
-
280
-
281
-
282
-
283
-
284
-
285
-
286
-
287
-
288
-
289
-
290
-
291
-
292
-
293
-
294
-
295
-
296
-
297
-
298
-
299
-
300
-
301
-
302
-
303
-
304
-
305
-
306
-
307
-
308
-
309
-
310
-
311
-
312
-
313
-
314
-
315
-
316
-
317
-
318
-
319
-
320
-
321
-
322
-
323
-
324
-
325
-
326
-
327
-
328
-
329
-
330
-
331
-
332
-
333
-
334
-
335
-
336
-
337
-
338
-
339
-
340
-
341
-
 342
342 -
 343
343 -
 344
344 -
 345
345 -
 346
346 -
 347
347 -
 348
348 -
 349
349 -
 350
350 -
 351
351 -
 352
352 -
 353
353 -
 354
354 -
 355
355 -
 356
356 -
 357
357 -
 358
358 -
 359
359 -
 360
360 -
 361
361 -
 362
362 -
363
-
364
-
365
-
366
-
367
-
368
-
369
-
370
-
371
-
372
-
373
-
374
-
375
-
376
-
377
-
378
-
379
-
380
-
381
-
382
-
383
-
384
-
385
-
386
-
387
-
388
-
389
-
390
 |
 |

Additional information
RBS Group Annual Report and Accounts 2009350
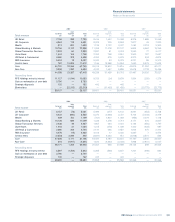
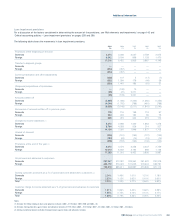
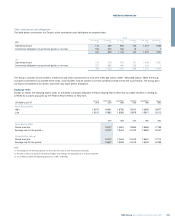
2009 2009 2008 2007 2006 2005
Summary consolidated income statement $m £m £m £m £m £m
Net interest income 26,682 16,504 18,675 12,069 10,596 9,918
Non-interest income (1, 2) 35,868 22,186 7,193 18,297 17,406 15,984
Total income 62,550 38,690 25,868 30,366 28,002 25,902
Operating expenses (3, 4, 5, 6, 7) (34,723) (21,478) (54,202) (13,942) (12,480) (11,946)
Profit/(loss) before other operating charges and impairment losses 27,827 17,212 (28,334) 16,424 15,522 13,956
Insurance net claims (7,852) (4,857) (4,430) (4,624) (4,458) (4,313)
Impairment (24,170) (14,950) (8,072) (1,968) (1,878) (1,707)
Operating (loss)/profit before tax (4,195) (2,595) (40,836) 9,832 9,186 7,936
Tax 600 371 2,323 (2,044) (2,689) (2,378)
(Loss)/profit from continuing operations (3,595) (2,224) (38,513) 7,788 6,497 5,558
(Loss)/profit from discontinued operations, net of tax (160) (99) 3,971 (76) — —
(Loss)/profit for the year (3,755) (2,323) (34,542) 7,712 6,497 5,558
(Loss)/profit attributable to:
Minority interests 564 349 (10,832) 163 104 57
Preference shareholders 1,420 878 536 246 191 109
Paid-in equity holders 92 57 60———
Ordinary and B shareholders (5,831) (3,607) (24,306) 7,303 6,202 5,392
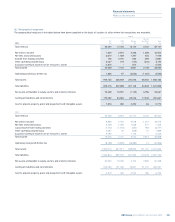
Notes:
(1) Includes gains on strategic disposals of £132 million in 2009 (2008 – £442 million; 2007 and 2006 – nil; 2005 – £333 million).
(2) Includes gain on redemption of own debt of £3,790 million in 2009.
(3) Includes loss on sale of subsidiaries of £93 million in 2005.
(4) Includes integration and restructuring costs of £1,286 million in 2009 (2008 – £1,357 million; 2007 – £108 million; 2006 – £134 million; 2005 – £458 million).
(5) Includes purchased intangibles amortisation of £607 million in 2009 (2008 – £919 million; 2007 – £234 million; 2006 – £94 million; 2005 – £97 million).
(6) Includes write-down of goodwill and other intangibles assets of £363 million in 2009 (2008 – £32,581 million).
(7) Includes gains on pensions curtailment of £2,148 million in 2009.
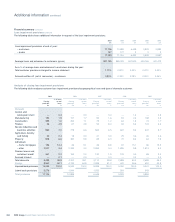
2009 2009 2008 2007 2006 2005
Summary consolidated balance sheet $m £m £m £m £m £m
Loans and advances 1,325,930 820,146 1,012,919 1,047,998 549,499 487,813
Debt securities and equity shares 463,641 286,782 293,879 347,682 146,246 135,804
Derivatives and settlement balances 733,152 453,487 1,010,391 293,991 109,506 89,470
Other assets 219,986 136,071 84,463 151,158 51,581 51,542
Total assets 2,742,709 1,696,486 2,401,652 1,840,829 856,832 764,629
Owners’ equity 125,676 77,736 58,879 53,038 40,227 35,435
Minority interests 27,314 16,895 21,619 38,388 5,263 2,109
Subordinated liabilities 60,872 37,652 49,154 38,043 27,654 28,274
Deposits 1,222,785 756,346 897,556 994,657 516,365 453,274
Derivatives, settlement balances and short positions 767,960 475,017 1,025,641 363,073 152,988 128,228
Other liabilities 538,102 332,840 348,803 353,630 114,335 117,309
Total liabilities and equity 2,742,709 1,696,486 2,401,652 1,840,829 856,832 764,629
Financial summary
The Group’s financial statements are prepared in accordance with IFRS.
Selected data under IFRS for each of the five years ended 31
December 2009 are presented on pages 350 to 359.
The dollar financial information included below has been converted from
sterling at a rate of £1.00 to US$1.6167, being the Noon Buying Rate on
31 December 2009.