RBS 2009 Annual Report Download - page 17
Download and view the complete annual report
Please find page 17 of the 2009 RBS annual report below. You can navigate through the pages in the report by either clicking on the pages listed below, or by using the keyword search tool below to find specific information within the annual report.-
 1
1 -
2
-
3
-
4
-
5
-
6
-
 7
7 -
 8
8 -
 9
9 -
 10
10 -
 11
11 -
 12
12 -
 13
13 -
 14
14 -
 15
15 -
 16
16 -
 17
17 -
 18
18 -
 19
19 -
 20
20 -
 21
21 -
 22
22 -
 23
23 -
 24
24 -
 25
25 -
 26
26 -
 27
27 -
28
-
29
-
30
-
31
-
32
-
33
-
34
-
35
-
36
-
37
-
38
-
39
-
40
-
41
-
42
-
43
-
44
-
45
-
46
-
47
-
48
-
49
-
50
-
51
-
52
-
53
-
54
-
55
-
56
-
57
-
58
-
59
-
60
-
61
-
62
-
63
-
64
-
65
-
66
-
67
-
68
-
69
-
70
-
71
-
72
-
73
-
74
-
75
-
76
-
77
-
78
-
79
-
80
-
81
-
82
-
83
-
84
-
85
-
86
-
87
-
88
-
89
-
90
-
91
-
92
-
93
-
94
-
95
-
96
-
97
-
98
-
99
-
100
-
101
-
102
-
103
-
104
-
105
-
106
-
107
-
108
-
109
-
110
-
111
-
112
-
113
-
114
-
115
-
116
-
117
-
118
-
119
-
120
-
121
-
122
-
123
-
124
-
125
-
126
-
127
-
128
-
129
-
130
-
131
-
132
-
133
-
134
-
135
-
136
-
137
-
138
-
139
-
140
-
141
-
142
-
143
-
144
-
145
-
146
-
147
-
148
-
149
-
150
-
151
-
152
-
153
-
154
-
155
-
156
-
157
-
158
-
159
-
160
-
161
-
162
-
163
-
164
-
165
-
166
-
167
-
168
-
169
-
170
-
171
-
172
-
173
-
174
-
175
-
176
-
177
-
178
-
179
-
180
-
181
-
182
-
183
-
184
-
185
-
186
-
187
-
188
-
189
-
190
-
191
-
192
-
193
-
194
-
195
-
196
-
197
-
198
-
199
-
200
-
201
-
202
-
203
-
204
-
205
-
206
-
207
-
208
-
209
-
210
-
211
-
212
-
213
-
214
-
215
-
216
-
217
-
218
-
219
-
220
-
221
-
222
-
223
-
224
-
225
-
226
-
227
-
228
-
229
-
230
-
231
-
232
-
233
-
234
-
235
-
236
-
237
-
238
-
239
-
240
-
241
-
242
-
243
-
244
-
245
-
246
-
247
-
248
-
249
-
250
-
251
-
252
-
253
-
254
-
255
-
256
-
257
-
258
-
259
-
260
-
261
-
262
-
263
-
264
-
265
-
266
-
267
-
268
-
269
-
270
-
271
-
272
-
273
-
274
-
275
-
276
-
277
-
278
-
279
-
280
-
281
-
282
-
283
-
284
-
285
-
286
-
287
-
288
-
289
-
290
-
291
-
292
-
293
-
294
-
295
-
296
-
297
-
298
-
299
-
300
-
301
-
302
-
303
-
304
-
305
-
306
-
307
-
308
-
309
-
310
-
311
-
312
-
313
-
314
-
315
-
316
-
317
-
318
-
319
-
320
-
321
-
322
-
323
-
324
-
325
-
326
-
327
-
328
-
329
-
330
-
331
-
332
-
333
-
334
-
335
-
336
-
337
-
338
-
339
-
340
-
341
-
342
-
343
-
344
-
345
-
346
-
347
-
348
-
349
-
350
-
351
-
352
-
353
-
354
-
355
-
356
-
357
-
358
-
359
-
360
-
361
-
362
-
363
-
364
-
365
-
366
-
367
-
368
-
369
-
370
-
371
-
372
-
373
-
374
-
375
-
376
-
377
-
378
-
379
-
380
-
381
-
382
-
383
-
384
-
385
-
386
-
387
-
388
-
389
-
390
 |
 |

15RBS Group Annual Report and Accounts 2009
Our strategic plan and progress
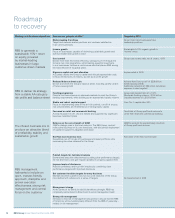
Roadmap to recovery
Our progress so far
Each of the Group’s Core businesses maintained or enhanced its market position in 2009.
In the UK, RBS maintained its market leading franchises in retail (No.2), small business (No.1) and corporate and commercial banking (No.1).
2009 was not a normal year. Volatility and unprecedented, unconventional monetary policy interventions produced strong income growth in some businesses,
while the recession depressed it in others. All the Core business franchises have shown their resilience through difficult economic conditions, and are well positioned
as the major economies in which they operate start to recover.
Good progress has been made in the cost control initiatives across the Group, including major technology and back office restructuring.
By the end of 2009 £1.3 billion of costs had been eliminated from RBS, notably in the areas of IT and property infrastructure, and through improved
employee efficiency programmes.
The Core bank cost:income ratio, net of claims, improved from 66.2% in 2008 to 53.5% in 2009.
Risk weighted assets, return on equity and fully allocated cost:income ratio targets set at Divisional as well as Group level.
During 2009 total assets were cut by £696 billion with funded assets declining by £143 billion.
Non-Core reduced its total third party assets, excluding derivatives, to £201 billion.
Tier 1 leverage ratio declined from 21.2x in 2008 to 17.0x in 2009.
The Group’s loan:deposit ratio, net of provisions, improved to 135% in 2009 from 151% in 2008. The Core loan:deposit ratio was 104% compared to 118% in 2008.
Wholesale unsecured funding of less than one year duration has declined to £250 billion from £343 billion in 2008.
Liquidity reserves increased by £81 billion to £171 billion during 2009.
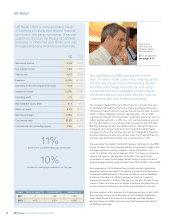
At the end of 2009 the Group’s Core Tier 1 ratio was 11%.
The Asset Protection Scheme, to which RBS acceded in December 2009, underpins our capital strength by providing protection in the event of severe market stress.
In the UK, the number of Retail current accounts increased by more than 3% on the year and the number of mortgage accounts by 10%.
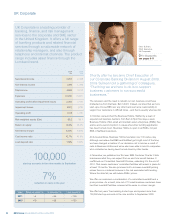
UK Corporate Banking opened 100,000 start-up accounts in the nine months to September 2009.
Ulster Bank held SME and corporate customer numbers stable over the last year and increased consumer accounts by 3%, compared with December 2008.
US Retail added 58,000 personal checking accounts over the course of the year.
GBM’s total third party assets, excluding derivatives, were down 17%, or 13% at constant exchange rates, compared with 31 December 2008, driven by a 43%
reduction in loans and advances as customers took advantage of favourable capital market conditions to raise alternative forms of finance to bank debt.
This reduction was partially offset by an increase in liquid assets.
GBM’s risk-weighted assets decreased 19%, or 15% at constant exchange rates, reflecting the fall in third party assets and the Group’s continued focus
on reducing its risk profile and balance sheet usage.
Non-Core Division reduced its portfolio of assets by £122 billion (36%) in 2009.
The Group sold its 50% interest in the online Spanish motor insurer Linea Directa in 2009, as well as its 5% stake in Bank of China.
RBS also agreed to sell its retail and commercial banking businesses in Indonesia, Hong Kong, Singapore and Taiwan, and GBM/GTS operations in the Philippines,
Taiwan and Vietnam. It remains committed to the sale of certain other parts of its Asian franchise.
The Investment Strategies business of RBS Asset Management was sold to Aberdeen Asset Management in January 2010.
The non-US operations of RBS Sempra Commodities, the Group’s joint venture business with California-based Sempra Energy, were sold to J.P. Morgan in February 2010.
Sale processes are proceeding in respect of the Global Merchant Services business of GTS and RBS branches in England and Wales, and NatWest branches in Scotland.
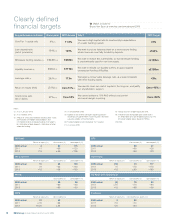
RBS has published a series of financial targets, for the Group as a whole and for individual Divisions (see page 18).
We are delivering our Strategic Plan ahead of schedule on both value creation (improvement of Core Bank) and risk reduction (Non-Core run-off).
RBS set a new benchmark for disclosure among UK banks, in terms of both level and frequency (e.g. only UK bank to do full quarterly reporting).
Each Division is being monitored against a variety of market position metrics and customer satisfaction scores.
Good progress was made last year. For example, our share of the UK mortgage lending market (gross) increased to 12% from 7% in 2008. Also, Business & Commercial
Banking and Corporate & Institutional Banking both maintained their market-leading customer satisfaction scores.
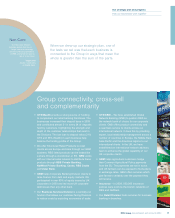
Progress on intra-Group connectivity/cross sales is also assessed. For example, 500,000 insurance policies were sold via the branch networks of RBS and NatWest.
The Group Board has been significantly changed with a new Chairman, Group Chief Executive, Group Finance Director, Senior Independent Director and several new members.
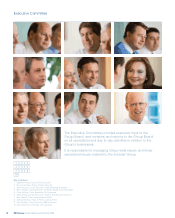
The new Executive Committee was established in 2009 comprising the chief executives of the customer-facing Divisions of the Group, as well as the Chief Financial
Officer, Head of Restructuring and Risk, and the Chief Administration Officer.
The Group’s new Board Risk Committee will regularly analyse the risk profile of the Group, identify any longer-term threats and make recommendations to the Board
as appropriate. See page 19 for an overview of key risk developments in 2009, and the steps we took to mitigate them.