RBS 2009 Annual Report Download - page 199
Download and view the complete annual report
Please find page 199 of the 2009 RBS annual report below. You can navigate through the pages in the report by either clicking on the pages listed below, or by using the keyword search tool below to find specific information within the annual report.-
 1
1 -
2
-
3
-
4
-
5
-
6
-
7
-
8
-
9
-
10
-
11
-
12
-
13
-
14
-
15
-
16
-
17
-
18
-
19
-
20
-
21
-
22
-
23
-
24
-
25
-
26
-
27
-
28
-
29
-
30
-
31
-
32
-
33
-
34
-
35
-
36
-
37
-
38
-
39
-
40
-
41
-
42
-
43
-
44
-
45
-
46
-
47
-
48
-
49
-
50
-
51
-
52
-
53
-
54
-
55
-
56
-
57
-
58
-
59
-
60
-
61
-
62
-
63
-
64
-
65
-
66
-
67
-
68
-
69
-
70
-
71
-
72
-
73
-
74
-
75
-
76
-
77
-
78
-
79
-
80
-
81
-
82
-
83
-
84
-
85
-
86
-
87
-
88
-
89
-
90
-
91
-
92
-
93
-
94
-
95
-
96
-
97
-
98
-
99
-
100
-
101
-
102
-
103
-
104
-
105
-
106
-
107
-
108
-
109
-
110
-
111
-
112
-
113
-
114
-
115
-
116
-
117
-
118
-
119
-
120
-
121
-
122
-
123
-
124
-
125
-
126
-
127
-
128
-
129
-
130
-
131
-
132
-
133
-
134
-
135
-
136
-
137
-
138
-
139
-
140
-
141
-
142
-
143
-
144
-
145
-
146
-
147
-
148
-
149
-
150
-
151
-
152
-
153
-
154
-
155
-
156
-
157
-
158
-
159
-
160
-
161
-
162
-
163
-
164
-
165
-
166
-
167
-
168
-
169
-
170
-
171
-
172
-
173
-
174
-
175
-
176
-
177
-
178
-
179
-
180
-
181
-
182
-
183
-
184
-
185
-
186
-
187
-
188
-
 189
189 -
 190
190 -
 191
191 -
 192
192 -
 193
193 -
 194
194 -
 195
195 -
 196
196 -
 197
197 -
 198
198 -
 199
199 -
 200
200 -
 201
201 -
 202
202 -
 203
203 -
 204
204 -
 205
205 -
 206
206 -
 207
207 -
 208
208 -
 209
209 -
210
-
211
-
212
-
213
-
214
-
215
-
216
-
217
-
218
-
219
-
220
-
221
-
222
-
223
-
224
-
225
-
226
-
227
-
228
-
229
-
230
-
231
-
232
-
233
-
234
-
235
-
236
-
237
-
238
-
239
-
240
-
241
-
242
-
243
-
244
-
245
-
246
-
247
-
248
-
249
-
250
-
251
-
252
-
253
-
254
-
255
-
256
-
257
-
258
-
259
-
260
-
261
-
262
-
263
-
264
-
265
-
266
-
267
-
268
-
269
-
270
-
271
-
272
-
273
-
274
-
275
-
276
-
277
-
278
-
279
-
280
-
281
-
282
-
283
-
284
-
285
-
286
-
287
-
288
-
289
-
290
-
291
-
292
-
293
-
294
-
295
-
296
-
297
-
298
-
299
-
300
-
301
-
302
-
303
-
304
-
305
-
306
-
307
-
308
-
309
-
310
-
311
-
312
-
313
-
314
-
315
-
316
-
317
-
318
-
319
-
320
-
321
-
322
-
323
-
324
-
325
-
326
-
327
-
328
-
329
-
330
-
331
-
332
-
333
-
334
-
335
-
336
-
337
-
338
-
339
-
340
-
341
-
342
-
343
-
344
-
345
-
346
-
347
-
348
-
349
-
350
-
351
-
352
-
353
-
354
-
355
-
356
-
357
-
358
-
359
-
360
-
361
-
362
-
363
-
364
-
365
-
366
-
367
-
368
-
369
-
370
-
371
-
372
-
373
-
374
-
375
-
376
-
377
-
378
-
379
-
380
-
381
-
382
-
383
-
384
-
385
-
386
-
387
-
388
-
389
-
390
 |
 |

Business review
Risk, capital and liquidity management
197RBS Group Annual Report and Accounts 2009
Credit derivative product companies (CDPC)
A CDPC is a company that sells protection on credit derivatives. CDPCs
are similar to monoline insurers, however, they are not regulated as
insurers.
The Group has purchased credit protection from CDPCs through
tranched and single name credit derivatives. The Group’s exposure to
CDPCs is predominantly due to tranched credit derivatives (tranches).
A tranche references a portfolio of loans and bonds and provides
protection against total portfolio default losses exceeding a certain
percentage of the portfolio notional (the attachment point) up to another
percentage (the detachment point). The Group has predominantly
traded senior tranches with CDPCs, the average attachment and
detachment points are 15% and 51% respectively (2008 – 16% and
50% respectively), and the majority of the loans and bonds in the
reference portfolios are investment grade.
The gross mark-to-market of the CDPC protection is determined using
industry standard models. The methodology employed to calculate the
CDPC CVA is different to that outlined above for monolines, as there are
no market observable credit spreads and recovery levels for these
entities. The level of expected loss on CDPC exposures is estimated by
analysing the underlying trades and the cost of hedging expected
default losses in excess of the capital available in each vehicle.
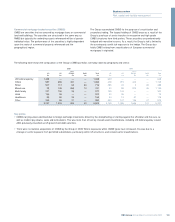
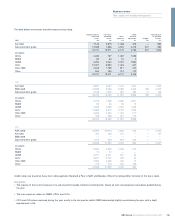
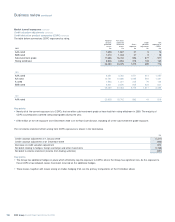
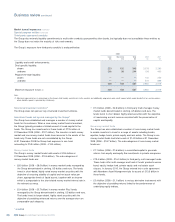
A summary of the Group’s exposure to CDPCs is detailed below:
2009 2008 2007
£m £m £m
Gross exposure to CDPCs 1,275 4,776 863
Credit valuation adjustment (499) (1,311) (44)
Net exposure to CDPCs 776 3,465 819
CVA as a % of gross exposure 39% 27% 5%
Key points
•The exposure to CDPCs reduced significantly during the year mainly due to a combination of tighter credit spreads of the underlying reference
loans and bonds, and a decrease in the relative value of senior tranches compared with the underlying reference portfolios. The trades with CDPCs
are predominantly US and Canadian dollar denominated, and the strengthening of sterling against the US dollar has further reduced the exposure,
partially off-set by the weakening of sterling against the Canadian dollar.
•The overall level of CVA decreased, in line with the reduction in exposure to these counterparties, however on a relative basis the CVA increased
from 27% to 39%. This reflects the perceived deterioration of the credit quality of the CDPCs as reflected by ratings down-grades. Further analysis
of the Group’s exposure to CDPCs by counterparty credit rating is shown in the following table.
RWAs*
Counterparty and credit RWAs relating to gross CDPC exposures increased from £5.0 billion to £7.5 billion over the year. In addition regulatory capital
deductions of £347 million were taken at the end of the year (2008 – nil).
* unaudited