RBS 2009 Annual Report Download - page 303
Download and view the complete annual report
Please find page 303 of the 2009 RBS annual report below. You can navigate through the pages in the report by either clicking on the pages listed below, or by using the keyword search tool below to find specific information within the annual report.-
 1
1 -
2
-
3
-
4
-
5
-
6
-
7
-
8
-
9
-
10
-
11
-
12
-
13
-
14
-
15
-
16
-
17
-
18
-
19
-
20
-
21
-
22
-
23
-
24
-
25
-
26
-
27
-
28
-
29
-
30
-
31
-
32
-
33
-
34
-
35
-
36
-
37
-
38
-
39
-
40
-
41
-
42
-
43
-
44
-
45
-
46
-
47
-
48
-
49
-
50
-
51
-
52
-
53
-
54
-
55
-
56
-
57
-
58
-
59
-
60
-
61
-
62
-
63
-
64
-
65
-
66
-
67
-
68
-
69
-
70
-
71
-
72
-
73
-
74
-
75
-
76
-
77
-
78
-
79
-
80
-
81
-
82
-
83
-
84
-
85
-
86
-
87
-
88
-
89
-
90
-
91
-
92
-
93
-
94
-
95
-
96
-
97
-
98
-
99
-
100
-
101
-
102
-
103
-
104
-
105
-
106
-
107
-
108
-
109
-
110
-
111
-
112
-
113
-
114
-
115
-
116
-
117
-
118
-
119
-
120
-
121
-
122
-
123
-
124
-
125
-
126
-
127
-
128
-
129
-
130
-
131
-
132
-
133
-
134
-
135
-
136
-
137
-
138
-
139
-
140
-
141
-
142
-
143
-
144
-
145
-
146
-
147
-
148
-
149
-
150
-
151
-
152
-
153
-
154
-
155
-
156
-
157
-
158
-
159
-
160
-
161
-
162
-
163
-
164
-
165
-
166
-
167
-
168
-
169
-
170
-
171
-
172
-
173
-
174
-
175
-
176
-
177
-
178
-
179
-
180
-
181
-
182
-
183
-
184
-
185
-
186
-
187
-
188
-
189
-
190
-
191
-
192
-
193
-
194
-
195
-
196
-
197
-
198
-
199
-
200
-
201
-
202
-
203
-
204
-
205
-
206
-
207
-
208
-
209
-
210
-
211
-
212
-
213
-
214
-
215
-
216
-
217
-
218
-
219
-
220
-
221
-
222
-
223
-
224
-
225
-
226
-
227
-
228
-
229
-
230
-
231
-
232
-
233
-
234
-
235
-
236
-
237
-
238
-
239
-
240
-
241
-
242
-
243
-
244
-
245
-
246
-
247
-
248
-
249
-
250
-
251
-
252
-
253
-
254
-
255
-
256
-
257
-
258
-
259
-
260
-
261
-
262
-
263
-
264
-
265
-
266
-
267
-
268
-
269
-
270
-
271
-
272
-
273
-
274
-
275
-
276
-
277
-
278
-
279
-
280
-
281
-
282
-
283
-
284
-
285
-
286
-
287
-
288
-
289
-
290
-
291
-
292
-
 293
293 -
 294
294 -
 295
295 -
 296
296 -
 297
297 -
 298
298 -
 299
299 -
 300
300 -
 301
301 -
 302
302 -
 303
303 -
 304
304 -
 305
305 -
 306
306 -
 307
307 -
 308
308 -
 309
309 -
 310
310 -
 311
311 -
 312
312 -
 313
313 -
314
-
315
-
316
-
317
-
318
-
319
-
320
-
321
-
322
-
323
-
324
-
325
-
326
-
327
-
328
-
329
-
330
-
331
-
332
-
333
-
334
-
335
-
336
-
337
-
338
-
339
-
340
-
341
-
342
-
343
-
344
-
345
-
346
-
347
-
348
-
349
-
350
-
351
-
352
-
353
-
354
-
355
-
356
-
357
-
358
-
359
-
360
-
361
-
362
-
363
-
364
-
365
-
366
-
367
-
368
-
369
-
370
-
371
-
372
-
373
-
374
-
375
-
376
-
377
-
378
-
379
-
380
-
381
-
382
-
383
-
384
-
385
-
386
-
387
-
388
-
389
-
390
 |
 |

301RBS Group Annual Report and Accounts 2009
Financial statements
Notes on the accounts
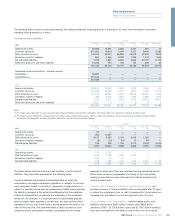
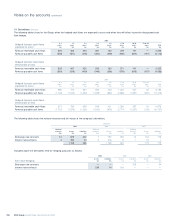
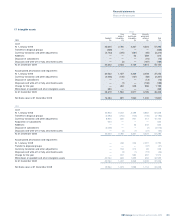
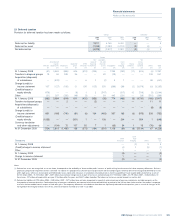
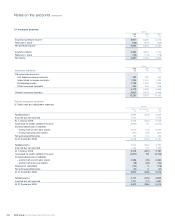
17 Intangible assets Group
Core Other Internally
deposit purchased generated
Goodwill intangibles intangibles software Total
2009 £m £m £m £m £m
Cost:
At 1 January 2009 45,624 2,780 4,367 4,524 57,295
Transfers to disposal groups (238) — — — (238)
Currency translation and other adjustments (2,743) (225) (281) (65) (3,314)
Additions — — 53 559 612
Disposal of subsidiaries — — — (16) (16)
Disposals and write-off of fully amortised assets — (2) — (187) (189)
At 31 December 2009 42,643 2,553 4,139 4,815 54,150
Accumulated amortisation and impairment:
At 1 January 2009 30,062 1,407 2,369 3,408 37,246
Currency translation and other adjustments (2,046) (106) (137) (58) (2,347)
Disposal of subsidiaries — — — (13) (13)
Disposals and write-off of fully amortised assets — (1) — (138) (139)
Charge for the year — 262 345 586 1,193
Write down of goodwill and other intangible assets 363 — — — 363
At 31 December 2009 28,379 1,562 2,577 3,785 36,303
Net book value at 31 December 2009 14,264 991 1,562 1,030 17,847
2008
Cost:
At 1 January 2008 42,953 2,344 3,489 3,882 52,668
Transfers to disposal groups (3,692) (240) (105) (146) (4,183)
Currency translation and other adjustments 8,905 680 961 214 10,760
Acquisition of subsidiaries 524 — — — 524
Additions — — 23 602 625
Disposal of subsidiaries (3,066) — — (7) (3,073)
Disposals and write-off of fully amortised assets — (4) (1) (21) (26)
At 31 December 2008 45,624 2,780 4,367 4,524 57,295
Accumulated amortisation and impairment:
At 1 January 2008 — 238 223 2,291 2,752
Transfer to disposal groups — — — (37) (37)
Currency translation and other adjustments — 150 210 69 429
Disposals and write-off of fully amortised assets — (3) (1) (19) (23)
Charge for the year — 337 582 651 1,570
Write down of goodwill and other intangible assets 30,062 685 1,355 453 32,555
At 31 December 2008 30,062 1,407 2,369 3,408 37,246
Net book value at 31 December 2008 15,562 1,373 1,998 1,116 20,049