RBS 2009 Annual Report Download - page 153
Download and view the complete annual report
Please find page 153 of the 2009 RBS annual report below. You can navigate through the pages in the report by either clicking on the pages listed below, or by using the keyword search tool below to find specific information within the annual report.-
 1
1 -
2
-
3
-
4
-
5
-
6
-
7
-
8
-
9
-
10
-
11
-
12
-
13
-
14
-
15
-
16
-
17
-
18
-
19
-
20
-
21
-
22
-
23
-
24
-
25
-
26
-
27
-
28
-
29
-
30
-
31
-
32
-
33
-
34
-
35
-
36
-
37
-
38
-
39
-
40
-
41
-
42
-
43
-
44
-
45
-
46
-
47
-
48
-
49
-
50
-
51
-
52
-
53
-
54
-
55
-
56
-
57
-
58
-
59
-
60
-
61
-
62
-
63
-
64
-
65
-
66
-
67
-
68
-
69
-
70
-
71
-
72
-
73
-
74
-
75
-
76
-
77
-
78
-
79
-
80
-
81
-
82
-
83
-
84
-
85
-
86
-
87
-
88
-
89
-
90
-
91
-
92
-
93
-
94
-
95
-
96
-
97
-
98
-
99
-
100
-
101
-
102
-
103
-
104
-
105
-
106
-
107
-
108
-
109
-
110
-
111
-
112
-
113
-
114
-
115
-
116
-
117
-
118
-
119
-
120
-
121
-
122
-
123
-
124
-
125
-
126
-
127
-
128
-
129
-
130
-
131
-
132
-
133
-
134
-
135
-
136
-
137
-
138
-
139
-
140
-
141
-
142
-
 143
143 -
 144
144 -
 145
145 -
 146
146 -
 147
147 -
 148
148 -
 149
149 -
 150
150 -
 151
151 -
 152
152 -
 153
153 -
 154
154 -
 155
155 -
 156
156 -
 157
157 -
 158
158 -
 159
159 -
 160
160 -
 161
161 -
 162
162 -
 163
163 -
164
-
165
-
166
-
167
-
168
-
169
-
170
-
171
-
172
-
173
-
174
-
175
-
176
-
177
-
178
-
179
-
180
-
181
-
182
-
183
-
184
-
185
-
186
-
187
-
188
-
189
-
190
-
191
-
192
-
193
-
194
-
195
-
196
-
197
-
198
-
199
-
200
-
201
-
202
-
203
-
204
-
205
-
206
-
207
-
208
-
209
-
210
-
211
-
212
-
213
-
214
-
215
-
216
-
217
-
218
-
219
-
220
-
221
-
222
-
223
-
224
-
225
-
226
-
227
-
228
-
229
-
230
-
231
-
232
-
233
-
234
-
235
-
236
-
237
-
238
-
239
-
240
-
241
-
242
-
243
-
244
-
245
-
246
-
247
-
248
-
249
-
250
-
251
-
252
-
253
-
254
-
255
-
256
-
257
-
258
-
259
-
260
-
261
-
262
-
263
-
264
-
265
-
266
-
267
-
268
-
269
-
270
-
271
-
272
-
273
-
274
-
275
-
276
-
277
-
278
-
279
-
280
-
281
-
282
-
283
-
284
-
285
-
286
-
287
-
288
-
289
-
290
-
291
-
292
-
293
-
294
-
295
-
296
-
297
-
298
-
299
-
300
-
301
-
302
-
303
-
304
-
305
-
306
-
307
-
308
-
309
-
310
-
311
-
312
-
313
-
314
-
315
-
316
-
317
-
318
-
319
-
320
-
321
-
322
-
323
-
324
-
325
-
326
-
327
-
328
-
329
-
330
-
331
-
332
-
333
-
334
-
335
-
336
-
337
-
338
-
339
-
340
-
341
-
342
-
343
-
344
-
345
-
346
-
347
-
348
-
349
-
350
-
351
-
352
-
353
-
354
-
355
-
356
-
357
-
358
-
359
-
360
-
361
-
362
-
363
-
364
-
365
-
366
-
367
-
368
-
369
-
370
-
371
-
372
-
373
-
374
-
375
-
376
-
377
-
378
-
379
-
380
-
381
-
382
-
383
-
384
-
385
-
386
-
387
-
388
-
389
-
390
 |
 |

Business review
Risk, capital and liquidity management
151RBS Group Annual Report and Accounts 2009
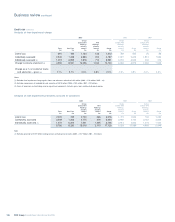
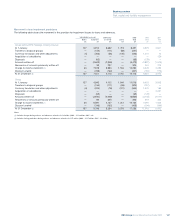
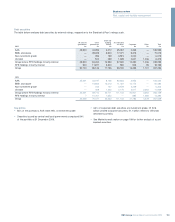
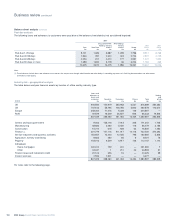
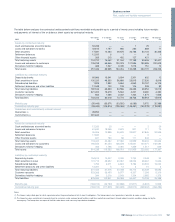
Debt securities
The table below analyses debt securities by external ratings, mapped on to the Standard & Poor’s ratings scale.
Bank and
UK and US Other Building Asset-backed
government government Society securities Corporate Other Total
2009 £m £m £m £m £m £m £m
AAA 49,820 44,396 4,012 65,067 2,263 — 165,558
BBB- and above — 39,009 9,523 17,071 5,476 — 71,079
Non-investment grade — 353 169 3,515 2,042 — 6,079
Unrated — 504 289 1,949 2,601 1,036 6,379
Group before RFS Holdings minority interest 49,820 84,262 13,993 87,602 12,382 1,036 249,095
RFS Holdings minority interest 904 11,871 3,803 580 906 95 18,159
Group 50,724 96,133 17,796 88,182 13,288 1,131 267,254
2008
AAA 35,301 43,197 8,126 93,853 3,953 — 184,430
BBB- and above — 15,862 13,013 11,437 10,172 — 50,484
Non-investment grade — 242 127 3,678 2,259 — 6,306
Unrated — 409 1,445 2,175 4,517 3,393 11,939
Group before RFS Holdings minority interest 35,301 59,710 22,711 111,143 20,901 3,393 253,159
RFS Holdings minority interest 7 10,761 1,652 — 885 1,085 14,390
Group 35,308 70,471 24,363 111,143 21,786 4,478 267,549
Key points
•66% of the portfolio is AAA rated; 95% is investment grade.
•Securities issued by central and local governments comprised 54%
of the portfolio at 31 December 2009.
•63% of corporate debt securities are investment grade. Of £2.6
billion unrated corporate securities, £1.1 billion relates to US funds
derivatives portfolio.
•See Market turmoil section on page 184 for further analysis of asset-
backed securities.