RBS 2009 Annual Report Download - page 262
Download and view the complete annual report
Please find page 262 of the 2009 RBS annual report below. You can navigate through the pages in the report by either clicking on the pages listed below, or by using the keyword search tool below to find specific information within the annual report.-
 1
1 -
2
-
3
-
4
-
5
-
6
-
7
-
8
-
9
-
10
-
11
-
12
-
13
-
14
-
15
-
16
-
17
-
18
-
19
-
20
-
21
-
22
-
23
-
24
-
25
-
26
-
27
-
28
-
29
-
30
-
31
-
32
-
33
-
34
-
35
-
36
-
37
-
38
-
39
-
40
-
41
-
42
-
43
-
44
-
45
-
46
-
47
-
48
-
49
-
50
-
51
-
52
-
53
-
54
-
55
-
56
-
57
-
58
-
59
-
60
-
61
-
62
-
63
-
64
-
65
-
66
-
67
-
68
-
69
-
70
-
71
-
72
-
73
-
74
-
75
-
76
-
77
-
78
-
79
-
80
-
81
-
82
-
83
-
84
-
85
-
86
-
87
-
88
-
89
-
90
-
91
-
92
-
93
-
94
-
95
-
96
-
97
-
98
-
99
-
100
-
101
-
102
-
103
-
104
-
105
-
106
-
107
-
108
-
109
-
110
-
111
-
112
-
113
-
114
-
115
-
116
-
117
-
118
-
119
-
120
-
121
-
122
-
123
-
124
-
125
-
126
-
127
-
128
-
129
-
130
-
131
-
132
-
133
-
134
-
135
-
136
-
137
-
138
-
139
-
140
-
141
-
142
-
143
-
144
-
145
-
146
-
147
-
148
-
149
-
150
-
151
-
152
-
153
-
154
-
155
-
156
-
157
-
158
-
159
-
160
-
161
-
162
-
163
-
164
-
165
-
166
-
167
-
168
-
169
-
170
-
171
-
172
-
173
-
174
-
175
-
176
-
177
-
178
-
179
-
180
-
181
-
182
-
183
-
184
-
185
-
186
-
187
-
188
-
189
-
190
-
191
-
192
-
193
-
194
-
195
-
196
-
197
-
198
-
199
-
200
-
201
-
202
-
203
-
204
-
205
-
206
-
207
-
208
-
209
-
210
-
211
-
212
-
213
-
214
-
215
-
216
-
217
-
218
-
219
-
220
-
221
-
222
-
223
-
224
-
225
-
226
-
227
-
228
-
229
-
230
-
231
-
232
-
233
-
234
-
235
-
236
-
237
-
238
-
239
-
240
-
241
-
242
-
243
-
244
-
245
-
246
-
247
-
248
-
249
-
250
-
251
-
 252
252 -
 253
253 -
 254
254 -
 255
255 -
 256
256 -
 257
257 -
 258
258 -
 259
259 -
 260
260 -
 261
261 -
 262
262 -
 263
263 -
 264
264 -
 265
265 -
 266
266 -
 267
267 -
 268
268 -
 269
269 -
 270
270 -
 271
271 -
 272
272 -
273
-
274
-
275
-
276
-
277
-
278
-
279
-
280
-
281
-
282
-
283
-
284
-
285
-
286
-
287
-
288
-
289
-
290
-
291
-
292
-
293
-
294
-
295
-
296
-
297
-
298
-
299
-
300
-
301
-
302
-
303
-
304
-
305
-
306
-
307
-
308
-
309
-
310
-
311
-
312
-
313
-
314
-
315
-
316
-
317
-
318
-
319
-
320
-
321
-
322
-
323
-
324
-
325
-
326
-
327
-
328
-
329
-
330
-
331
-
332
-
333
-
334
-
335
-
336
-
337
-
338
-
339
-
340
-
341
-
342
-
343
-
344
-
345
-
346
-
347
-
348
-
349
-
350
-
351
-
352
-
353
-
354
-
355
-
356
-
357
-
358
-
359
-
360
-
361
-
362
-
363
-
364
-
365
-
366
-
367
-
368
-
369
-
370
-
371
-
372
-
373
-
374
-
375
-
376
-
377
-
378
-
379
-
380
-
381
-
382
-
383
-
384
-
385
-
386
-
387
-
388
-
389
-
390
 |
 |

Notes on the accounts continued
RBS Group Annual Report and Accounts 2009260
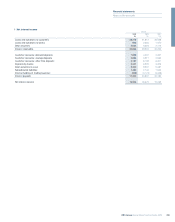
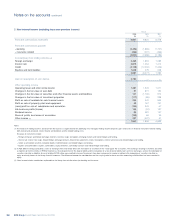
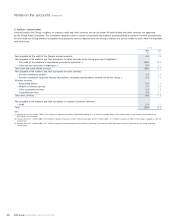
2 Non-interest income (excluding insurance premium income) Group
2009 2008 2007
£m £m £m
Fees and commissions receivable 9,831 9,831 8,278
Fees and commissions payable
– banking (2,456) (1,985) (1,727)
– insurance related (366) (401) (466)
(2,822) (2,386) (2,193)
Income/(loss) from trading activities (1)
Foreign exchange 2,465 1,994 1,085
Interest rate 3,875 1,454 1,414
Credit (4,108) (12,200) (1,446)
Equities and commodities 1,649 275 239
3,881 (8,477) 1,292
Gain on redemption of own debt (2) 3,790 ——
Other operating income
Operating lease and other rental income 1,391 1,525 1,671
Changes in the fair value of own debt 51 977 152
Changes in the fair value of securities and other financial assets and liabilities 101 (1,730) 970
Changes in the fair value of investment properties (117) (86) 288
Profit on sale of available-for-sale financial assets 294 342 544
Profit on sale of property, plant and equipment 43 167 741
(Loss)/profit on sale of subsidiaries and associates (135) 943 67
Life business profits/(losses) 156 (52) 187
Dividend income 86 281 137
Share of profits less losses of associates (195) 69 25
Other income (3) 287 (537) 51
1,962 1,899 4,833
Notes:
(1) The analysis of trading income is based on how the business is organised and the underlying risks managed. Trading income comprises gains and losses on financial instruments held for trading,
both realised and unrealised, interest income and dividends and the related funding costs.
The types of instruments include:
– Foreign exchange: spot foreign exchange contracts, currency swaps and options, emerging markets and related hedges and funding.
– Interest rate: interest rate swaps, forward foreign exchange contracts, forward rate agreements, interest rate options, interest rate futures and related hedges and funding.
– Credit: asset-backed securities, corporate bonds, credit derivatives and related hedges and funding.
– Equities and commodities: equities, commodities, equity derivatives, commodity contracts and related hedges and funding.
(2) In April 2009, the Group concluded a series of exchange offers and tender offers with the holders of a number of Tier 1 and Upper Tier 2 securities. The exchanges involving instruments classified
as liabilities all met the criteria in IFRS for treatment as the extinguishment of the original liability and the recognition of a new financial liability. Gains on these exchanges, and on the redemption of
securities classified as liabilities for cash, totalling £3,790 million were credited to income. No amounts have been recognised in income in relation to the redemption of securities classified as
equity or minority interest in the Group financial statements. The difference between the consideration and the carrying value for these securities amounting to £829 million has been recorded in
equity.
(3) Other income includes contributions attributable to the Group from activities other than banking and insurance.