RBS 2009 Annual Report Download - page 282
Download and view the complete annual report
Please find page 282 of the 2009 RBS annual report below. You can navigate through the pages in the report by either clicking on the pages listed below, or by using the keyword search tool below to find specific information within the annual report.-
 1
1 -
2
-
3
-
4
-
5
-
6
-
7
-
8
-
9
-
10
-
11
-
12
-
13
-
14
-
15
-
16
-
17
-
18
-
19
-
20
-
21
-
22
-
23
-
24
-
25
-
26
-
27
-
28
-
29
-
30
-
31
-
32
-
33
-
34
-
35
-
36
-
37
-
38
-
39
-
40
-
41
-
42
-
43
-
44
-
45
-
46
-
47
-
48
-
49
-
50
-
51
-
52
-
53
-
54
-
55
-
56
-
57
-
58
-
59
-
60
-
61
-
62
-
63
-
64
-
65
-
66
-
67
-
68
-
69
-
70
-
71
-
72
-
73
-
74
-
75
-
76
-
77
-
78
-
79
-
80
-
81
-
82
-
83
-
84
-
85
-
86
-
87
-
88
-
89
-
90
-
91
-
92
-
93
-
94
-
95
-
96
-
97
-
98
-
99
-
100
-
101
-
102
-
103
-
104
-
105
-
106
-
107
-
108
-
109
-
110
-
111
-
112
-
113
-
114
-
115
-
116
-
117
-
118
-
119
-
120
-
121
-
122
-
123
-
124
-
125
-
126
-
127
-
128
-
129
-
130
-
131
-
132
-
133
-
134
-
135
-
136
-
137
-
138
-
139
-
140
-
141
-
142
-
143
-
144
-
145
-
146
-
147
-
148
-
149
-
150
-
151
-
152
-
153
-
154
-
155
-
156
-
157
-
158
-
159
-
160
-
161
-
162
-
163
-
164
-
165
-
166
-
167
-
168
-
169
-
170
-
171
-
172
-
173
-
174
-
175
-
176
-
177
-
178
-
179
-
180
-
181
-
182
-
183
-
184
-
185
-
186
-
187
-
188
-
189
-
190
-
191
-
192
-
193
-
194
-
195
-
196
-
197
-
198
-
199
-
200
-
201
-
202
-
203
-
204
-
205
-
206
-
207
-
208
-
209
-
210
-
211
-
212
-
213
-
214
-
215
-
216
-
217
-
218
-
219
-
220
-
221
-
222
-
223
-
224
-
225
-
226
-
227
-
228
-
229
-
230
-
231
-
232
-
233
-
234
-
235
-
236
-
237
-
238
-
239
-
240
-
241
-
242
-
243
-
244
-
245
-
246
-
247
-
248
-
249
-
250
-
251
-
252
-
253
-
254
-
255
-
256
-
257
-
258
-
259
-
260
-
261
-
262
-
263
-
264
-
265
-
266
-
267
-
268
-
269
-
270
-
271
-
 272
272 -
 273
273 -
 274
274 -
 275
275 -
 276
276 -
 277
277 -
 278
278 -
 279
279 -
 280
280 -
 281
281 -
 282
282 -
 283
283 -
 284
284 -
 285
285 -
 286
286 -
 287
287 -
 288
288 -
 289
289 -
 290
290 -
 291
291 -
 292
292 -
293
-
294
-
295
-
296
-
297
-
298
-
299
-
300
-
301
-
302
-
303
-
304
-
305
-
306
-
307
-
308
-
309
-
310
-
311
-
312
-
313
-
314
-
315
-
316
-
317
-
318
-
319
-
320
-
321
-
322
-
323
-
324
-
325
-
326
-
327
-
328
-
329
-
330
-
331
-
332
-
333
-
334
-
335
-
336
-
337
-
338
-
339
-
340
-
341
-
342
-
343
-
344
-
345
-
346
-
347
-
348
-
349
-
350
-
351
-
352
-
353
-
354
-
355
-
356
-
357
-
358
-
359
-
360
-
361
-
362
-
363
-
364
-
365
-
366
-
367
-
368
-
369
-
370
-
371
-
372
-
373
-
374
-
375
-
376
-
377
-
378
-
379
-
380
-
381
-
382
-
383
-
384
-
385
-
386
-
387
-
388
-
389
-
390
 |
 |

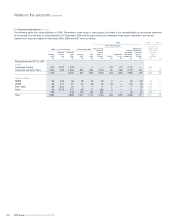
Notes on the accounts continued
RBS Group Annual Report and Accounts 2009280
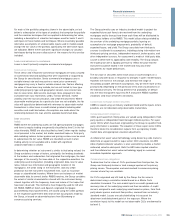
Credit valuation adjustments (CVA) represent an estimate of the
adjustment to fair value that a market participant would make to
incorporate the credit risk inherent in counterparty derivative exposures.
The Group makes such credit adjustments to derivative exposures it has
to counterparties, as well as debit valuation adjustments to liabilities
issued by the Group. CVA is discussed in Risk, capital and liquidity
management – Market turmoil exposures – Credit valuation adjustments
(pages 193 to 199). Bid-offer and liquidity reserves and own credit are
discussed below.
Bid-offer and liquidity reserves
Trading positions are adjusted to bid (for assets) or offer (for liabilities)
levels, by marking individual cash based positions directly to bid or offer
or by taking bid-offer reserves calculated on a portfolio basis for
derivatives.
The bid-offer approach is based on current market spreads and
standard market bucketing of risk. Risk data is used as the primary
source of information within bid-offer calculations and is aggregated
when it is more granular than market standard buckets.
Bid-offer adjustments for each risk factor are determined by
aggregating similar risk exposures arising on different products.
Additional basis bid/offer reserves are taken where these are charged in
the market. Risk associated with non identical underlying exposures is
not netted down unless there is evidence that the cost of closing the
combined risk exposure is less than the cost of closing on an individual
basis. For example: interest rate delta bid-offer methodology (when
viewed in isolation) allows aggregation of risk across different tenor
bases. Tenor basis bid-offer reserves are then applied to compensate
for the netting within the (original) delta bid-offer calculation.
Bid-offer spreads vary by maturity and risk type to reflect different
spreads in the market. For positions where there is no observable quote,
the bid-offer spreads are widened in comparison to proxies to reflect
reduced liquidity or observability. Bid-offer methodologies also
incorporate liquidity triggers whereby wider spreads are applied to risks
above pre-defined thresholds.
Netting is applied across risk buckets where there is market evidence to
support this. For example calendar netting and cross strike netting
effects are taken into account where such trades occur regularly within
the market. Netting will also apply where long and short risk in two
different risk buckets can be closed out in a single market transaction at
less cost than via two separate transactions (closing out the individual
bucketed risk in isolation).
Vanilla risk on exotic products is typically reserved as part of the overall
portfolio based calculation e.g. delta and vega risk is included within the
delta and vega bid-offer calculations. Aggregation of risk arising from
different models is in line with the Group’s risk management practices;
the model review control process considers the appropriateness of
model selection in this respect.
Product related risks such as correlation risk attract specific bid to offer
reserves. Additional reserves are provided for exotic products to ensure
overall reserves match market close-out costs. These market close-out
costs inherently incorporate risk decay and cross-effects which are
unlikely to be adequately reflected in the static hedge based on vanilla
instruments.
Where there is limited bid-offer information for a product a conservative
approach is taken, taking into account pricing approach and risk
management strategy.
Market risk close-out costs excluding CVA were £2,814 million as at 31
December 2009 (2008 – £3,260 million; 2007 – £1,154 million).
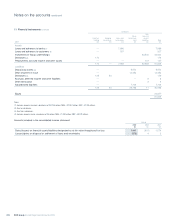
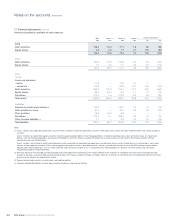
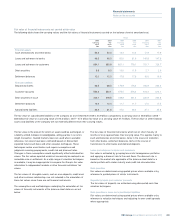
11 Financial instruments continued
Valuation reserves
When valuing financial instruments in the trading book, adjustments are made to mid-market valuations to cover bid-offer spread, liquidity and
credit risk.
Valuation reserves and adjustments comprise:
2009 2008 2007
£m £m £m
Credit valuation adjustments:
Monoline insurers 3,796 5,988 862
CDPCs 499 1,311 44
Other counterparties 1,588 1,738 263
5,883 9,037 1,169
Bid-offer and liquidity reserves 2,814 3,260 1,154
8,697 12,297 2,323
Debit valuation adjustments:
Debt securities in issue (2,331) (2,373) (456)
Derivatives (467) (450) —
Total debit valuation adjustments (2,798) (2,823) (456)
Total reserves 5,899 9,474 1,867