RBS 2009 Annual Report Download - page 309
Download and view the complete annual report
Please find page 309 of the 2009 RBS annual report below. You can navigate through the pages in the report by either clicking on the pages listed below, or by using the keyword search tool below to find specific information within the annual report.-
 1
1 -
2
-
3
-
4
-
5
-
6
-
7
-
8
-
9
-
10
-
11
-
12
-
13
-
14
-
15
-
16
-
17
-
18
-
19
-
20
-
21
-
22
-
23
-
24
-
25
-
26
-
27
-
28
-
29
-
30
-
31
-
32
-
33
-
34
-
35
-
36
-
37
-
38
-
39
-
40
-
41
-
42
-
43
-
44
-
45
-
46
-
47
-
48
-
49
-
50
-
51
-
52
-
53
-
54
-
55
-
56
-
57
-
58
-
59
-
60
-
61
-
62
-
63
-
64
-
65
-
66
-
67
-
68
-
69
-
70
-
71
-
72
-
73
-
74
-
75
-
76
-
77
-
78
-
79
-
80
-
81
-
82
-
83
-
84
-
85
-
86
-
87
-
88
-
89
-
90
-
91
-
92
-
93
-
94
-
95
-
96
-
97
-
98
-
99
-
100
-
101
-
102
-
103
-
104
-
105
-
106
-
107
-
108
-
109
-
110
-
111
-
112
-
113
-
114
-
115
-
116
-
117
-
118
-
119
-
120
-
121
-
122
-
123
-
124
-
125
-
126
-
127
-
128
-
129
-
130
-
131
-
132
-
133
-
134
-
135
-
136
-
137
-
138
-
139
-
140
-
141
-
142
-
143
-
144
-
145
-
146
-
147
-
148
-
149
-
150
-
151
-
152
-
153
-
154
-
155
-
156
-
157
-
158
-
159
-
160
-
161
-
162
-
163
-
164
-
165
-
166
-
167
-
168
-
169
-
170
-
171
-
172
-
173
-
174
-
175
-
176
-
177
-
178
-
179
-
180
-
181
-
182
-
183
-
184
-
185
-
186
-
187
-
188
-
189
-
190
-
191
-
192
-
193
-
194
-
195
-
196
-
197
-
198
-
199
-
200
-
201
-
202
-
203
-
204
-
205
-
206
-
207
-
208
-
209
-
210
-
211
-
212
-
213
-
214
-
215
-
216
-
217
-
218
-
219
-
220
-
221
-
222
-
223
-
224
-
225
-
226
-
227
-
228
-
229
-
230
-
231
-
232
-
233
-
234
-
235
-
236
-
237
-
238
-
239
-
240
-
241
-
242
-
243
-
244
-
245
-
246
-
247
-
248
-
249
-
250
-
251
-
252
-
253
-
254
-
255
-
256
-
257
-
258
-
259
-
260
-
261
-
262
-
263
-
264
-
265
-
266
-
267
-
268
-
269
-
270
-
271
-
272
-
273
-
274
-
275
-
276
-
277
-
278
-
279
-
280
-
281
-
282
-
283
-
284
-
285
-
286
-
287
-
288
-
289
-
290
-
291
-
292
-
293
-
294
-
295
-
296
-
297
-
298
-
 299
299 -
 300
300 -
 301
301 -
 302
302 -
 303
303 -
 304
304 -
 305
305 -
 306
306 -
 307
307 -
 308
308 -
 309
309 -
 310
310 -
 311
311 -
 312
312 -
 313
313 -
 314
314 -
 315
315 -
 316
316 -
 317
317 -
 318
318 -
 319
319 -
320
-
321
-
322
-
323
-
324
-
325
-
326
-
327
-
328
-
329
-
330
-
331
-
332
-
333
-
334
-
335
-
336
-
337
-
338
-
339
-
340
-
341
-
342
-
343
-
344
-
345
-
346
-
347
-
348
-
349
-
350
-
351
-
352
-
353
-
354
-
355
-
356
-
357
-
358
-
359
-
360
-
361
-
362
-
363
-
364
-
365
-
366
-
367
-
368
-
369
-
370
-
371
-
372
-
373
-
374
-
375
-
376
-
377
-
378
-
379
-
380
-
381
-
382
-
383
-
384
-
385
-
386
-
387
-
388
-
389
-
390
 |
 |

307RBS Group Annual Report and Accounts 2009
Financial statements
Notes on the accounts
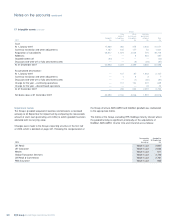
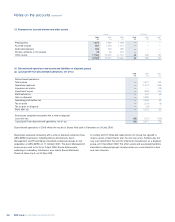
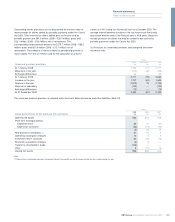
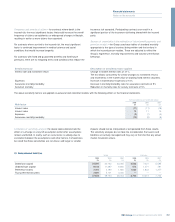
(b) Cash flows attributable to discontinued operations
Included within the Group’s cash flows are the following amounts attributable to discontinued operations:
2009 2008 2007
£m £m £m
Net cash flows from operating activities —(124) (1,304)
Net cash flows from investing activities —(368) 4,341
Net cash flows from financing activities —339 (25)
Net increase in cash and cash equivalents —287 3,172
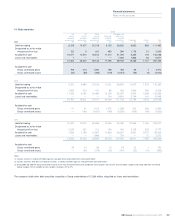
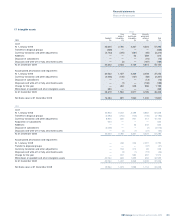
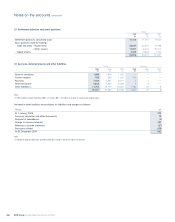
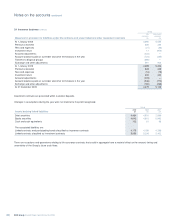
(c) Assets and liabilities of disposal groups Sempra Other 2009 2008 2007
£m £m £m £m £m
Assets of disposal groups
Cash and balances at central banks — 129 129 ——
Loans and advances to banks 314 74 388 ——
Loans and advances to customers 306 2,910 3,216 ——
Debt securities and equity shares 56 848 904 ——
Derivatives 6,361 — 6,361 ——
Intangible assets 238 — 238 ——
Settlement balances 1,579 — 1,579 ——
Property, plant and equipment 92 44 136 66 395
Other assets 5,257 160 5,417 ——
Discontinued operations and other disposal groups 14,203 4,165 18,368 66 395
Assets acquired exclusively with a view to disposal — 174 174 1,515 45,455
14,203 4,339 18,542 1,581 45,850
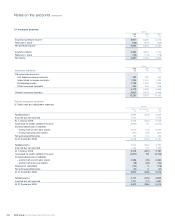
Liabilities of disposal groups
Deposits by banks 560 58 618 ——
Customer accounts 1,961 6,946 8,907 ——
Derivatives 6,262 421 6,683 ——
Settlement balances 950 — 950 ——
Subordinated liabilities —66——
Other liabilities 1,260 415 1,675 ——
Discontinued operations and other disposal groups 10,993 7,846 18,839 ——
Assets acquired exclusively with a view to disposal — 51 51 859 29,228
10,993 7,897 18,890 859 29,228