RBS 2009 Annual Report Download - page 201
Download and view the complete annual report
Please find page 201 of the 2009 RBS annual report below. You can navigate through the pages in the report by either clicking on the pages listed below, or by using the keyword search tool below to find specific information within the annual report.-
 1
1 -
2
-
3
-
4
-
5
-
6
-
7
-
8
-
9
-
10
-
11
-
12
-
13
-
14
-
15
-
16
-
17
-
18
-
19
-
20
-
21
-
22
-
23
-
24
-
25
-
26
-
27
-
28
-
29
-
30
-
31
-
32
-
33
-
34
-
35
-
36
-
37
-
38
-
39
-
40
-
41
-
42
-
43
-
44
-
45
-
46
-
47
-
48
-
49
-
50
-
51
-
52
-
53
-
54
-
55
-
56
-
57
-
58
-
59
-
60
-
61
-
62
-
63
-
64
-
65
-
66
-
67
-
68
-
69
-
70
-
71
-
72
-
73
-
74
-
75
-
76
-
77
-
78
-
79
-
80
-
81
-
82
-
83
-
84
-
85
-
86
-
87
-
88
-
89
-
90
-
91
-
92
-
93
-
94
-
95
-
96
-
97
-
98
-
99
-
100
-
101
-
102
-
103
-
104
-
105
-
106
-
107
-
108
-
109
-
110
-
111
-
112
-
113
-
114
-
115
-
116
-
117
-
118
-
119
-
120
-
121
-
122
-
123
-
124
-
125
-
126
-
127
-
128
-
129
-
130
-
131
-
132
-
133
-
134
-
135
-
136
-
137
-
138
-
139
-
140
-
141
-
142
-
143
-
144
-
145
-
146
-
147
-
148
-
149
-
150
-
151
-
152
-
153
-
154
-
155
-
156
-
157
-
158
-
159
-
160
-
161
-
162
-
163
-
164
-
165
-
166
-
167
-
168
-
169
-
170
-
171
-
172
-
173
-
174
-
175
-
176
-
177
-
178
-
179
-
180
-
181
-
182
-
183
-
184
-
185
-
186
-
187
-
188
-
189
-
190
-
 191
191 -
 192
192 -
 193
193 -
 194
194 -
 195
195 -
 196
196 -
 197
197 -
 198
198 -
 199
199 -
 200
200 -
 201
201 -
 202
202 -
 203
203 -
 204
204 -
 205
205 -
 206
206 -
 207
207 -
 208
208 -
 209
209 -
 210
210 -
 211
211 -
212
-
213
-
214
-
215
-
216
-
217
-
218
-
219
-
220
-
221
-
222
-
223
-
224
-
225
-
226
-
227
-
228
-
229
-
230
-
231
-
232
-
233
-
234
-
235
-
236
-
237
-
238
-
239
-
240
-
241
-
242
-
243
-
244
-
245
-
246
-
247
-
248
-
249
-
250
-
251
-
252
-
253
-
254
-
255
-
256
-
257
-
258
-
259
-
260
-
261
-
262
-
263
-
264
-
265
-
266
-
267
-
268
-
269
-
270
-
271
-
272
-
273
-
274
-
275
-
276
-
277
-
278
-
279
-
280
-
281
-
282
-
283
-
284
-
285
-
286
-
287
-
288
-
289
-
290
-
291
-
292
-
293
-
294
-
295
-
296
-
297
-
298
-
299
-
300
-
301
-
302
-
303
-
304
-
305
-
306
-
307
-
308
-
309
-
310
-
311
-
312
-
313
-
314
-
315
-
316
-
317
-
318
-
319
-
320
-
321
-
322
-
323
-
324
-
325
-
326
-
327
-
328
-
329
-
330
-
331
-
332
-
333
-
334
-
335
-
336
-
337
-
338
-
339
-
340
-
341
-
342
-
343
-
344
-
345
-
346
-
347
-
348
-
349
-
350
-
351
-
352
-
353
-
354
-
355
-
356
-
357
-
358
-
359
-
360
-
361
-
362
-
363
-
364
-
365
-
366
-
367
-
368
-
369
-
370
-
371
-
372
-
373
-
374
-
375
-
376
-
377
-
378
-
379
-
380
-
381
-
382
-
383
-
384
-
385
-
386
-
387
-
388
-
389
-
390
 |
 |

Business review
Risk, capital and liquidity management
199RBS Group Annual Report and Accounts 2009
CVA attributable to other counterparties
The CVA for all other counterparties is calculated on a portfolio basis
reflecting an estimate of the amount a third party would charge to
assume the credit risk.
Expected losses are determined from the market implied probability of
defaults and internally assessed recovery levels. The probability of
default is calculated with reference to observable credit spreads and
observable recovery levels. For counterparties where observable data
do not exist, the probability of default is determined from the average
credit spreads and recovery levels of baskets of similarly rated entities.
A weighting of 50% to 100% is applied to arrive at the CVA. The
weighting reflects portfolio churn and varies according to the
counterparty credit quality.
Expected losses are applied to estimated potential future exposures
which are modelled to reflect the volatility of the market factors which
drive the exposures and the correlation between those factors. Potential
future exposures arising from vanilla products (including interest rate
and foreign exchange derivatives) are modelled jointly using the Group’s
core counterparty risk systems. At 31 December 2009, over 75% of the
Group’s CVA held in relation to other counterparties arises on these
vanilla products. The exposures arising from all other product types are
modelled and assessed individually. The potential future exposure to
each counterparty is the aggregate of the exposures arising on the
underlying product types.
Correlation between exposure and counterparty risk is also
incorporated within the CVA calculation where this risk is considered
significant. The risk primarily arises on trades with emerging market
counterparties where the gross mark-to-market value of the trade, and
therefore the counterparty exposure, increases as the strength of the
local currency declines.
Collateral held under a credit support agreement is factored into the
CVA calculation. In such cases where the Group holds collateral against
counterparty exposures, CVA is held to the extent that residual risk
remains.
CVA is held against exposures to all counterparties with the exception
of the CDS protection that the Group has purchased from HMT, as part
of its participation in the APS, due to the unique features of this
derivative.
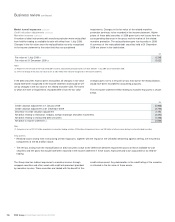
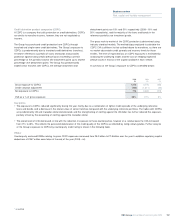
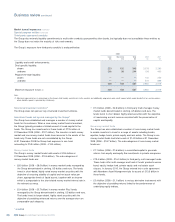
The net income statement effect arising from the change in level of CVA for all other counterparties and related trades is shown in the table below.
£m
Credit valuation adjustment at 1 January 2009 (1,738)
Credit valuation adjustment at 31 December 2009 (1,588)
Decrease in credit valuation adjustment 150
Net debit relating to hedges, foreign exchange and other movements (841)
Net debit to income statement (income from trading activities) (691)
Key points
•Losses arose on trades hedging the CVA held against other counterparties due to the tightening of credit spreads. These losses, together with
realised losses from counterparty defaults, are the primary cause of the loss arising on foreign exchange, hedges, realisations and other
movements.
•The net income statement effect was driven by updates to the CVA methodology, hedges and realised defaults off-setting CVA movements.
–The primary update applied to the CVA methodology reflected a market wide shift in the approach to pricing and managing counterparty risk.
The methodology change related to the calculation of the probability of default. The basis for this calculation moved from a blended market
implied and historic measure to the market implied methodology set out above. Other updates to the methodology were made to reflect the
correlation between exposure and counterparty risk.
–Prior to the update to the CVA methodology, CVA moves driven by changes to the historic element of the blended measure were not hedged,
resulting in losses during the year arising from related CVA increases.
–The CVA is calculated on a portfolio basis and reflects an estimate of the losses that will arise across the portfolio due to counterparty defaults.
It is not possible to perfectly hedge the risks driving the CVA and this leads to differences between CVA and hedge movements. Differences
also arise between realised default losses and the proportion of CVA held in relation to individual counterparties.