RBS 2009 Annual Report Download - page 96
Download and view the complete annual report
Please find page 96 of the 2009 RBS annual report below. You can navigate through the pages in the report by either clicking on the pages listed below, or by using the keyword search tool below to find specific information within the annual report.-
 1
1 -
2
-
3
-
4
-
5
-
6
-
7
-
8
-
9
-
10
-
11
-
12
-
13
-
14
-
15
-
16
-
17
-
18
-
19
-
20
-
21
-
22
-
23
-
24
-
25
-
26
-
27
-
28
-
29
-
30
-
31
-
32
-
33
-
34
-
35
-
36
-
37
-
38
-
39
-
40
-
41
-
42
-
43
-
44
-
45
-
46
-
47
-
48
-
49
-
50
-
51
-
52
-
53
-
54
-
55
-
56
-
57
-
58
-
59
-
60
-
61
-
62
-
63
-
64
-
65
-
66
-
67
-
68
-
69
-
70
-
71
-
72
-
73
-
74
-
75
-
76
-
77
-
78
-
79
-
80
-
81
-
82
-
83
-
84
-
85
-
 86
86 -
 87
87 -
 88
88 -
 89
89 -
 90
90 -
 91
91 -
 92
92 -
 93
93 -
 94
94 -
 95
95 -
 96
96 -
 97
97 -
 98
98 -
 99
99 -
 100
100 -
 101
101 -
 102
102 -
 103
103 -
 104
104 -
 105
105 -
 106
106 -
107
-
108
-
109
-
110
-
111
-
112
-
113
-
114
-
115
-
116
-
117
-
118
-
119
-
120
-
121
-
122
-
123
-
124
-
125
-
126
-
127
-
128
-
129
-
130
-
131
-
132
-
133
-
134
-
135
-
136
-
137
-
138
-
139
-
140
-
141
-
142
-
143
-
144
-
145
-
146
-
147
-
148
-
149
-
150
-
151
-
152
-
153
-
154
-
155
-
156
-
157
-
158
-
159
-
160
-
161
-
162
-
163
-
164
-
165
-
166
-
167
-
168
-
169
-
170
-
171
-
172
-
173
-
174
-
175
-
176
-
177
-
178
-
179
-
180
-
181
-
182
-
183
-
184
-
185
-
186
-
187
-
188
-
189
-
190
-
191
-
192
-
193
-
194
-
195
-
196
-
197
-
198
-
199
-
200
-
201
-
202
-
203
-
204
-
205
-
206
-
207
-
208
-
209
-
210
-
211
-
212
-
213
-
214
-
215
-
216
-
217
-
218
-
219
-
220
-
221
-
222
-
223
-
224
-
225
-
226
-
227
-
228
-
229
-
230
-
231
-
232
-
233
-
234
-
235
-
236
-
237
-
238
-
239
-
240
-
241
-
242
-
243
-
244
-
245
-
246
-
247
-
248
-
249
-
250
-
251
-
252
-
253
-
254
-
255
-
256
-
257
-
258
-
259
-
260
-
261
-
262
-
263
-
264
-
265
-
266
-
267
-
268
-
269
-
270
-
271
-
272
-
273
-
274
-
275
-
276
-
277
-
278
-
279
-
280
-
281
-
282
-
283
-
284
-
285
-
286
-
287
-
288
-
289
-
290
-
291
-
292
-
293
-
294
-
295
-
296
-
297
-
298
-
299
-
300
-
301
-
302
-
303
-
304
-
305
-
306
-
307
-
308
-
309
-
310
-
311
-
312
-
313
-
314
-
315
-
316
-
317
-
318
-
319
-
320
-
321
-
322
-
323
-
324
-
325
-
326
-
327
-
328
-
329
-
330
-
331
-
332
-
333
-
334
-
335
-
336
-
337
-
338
-
339
-
340
-
341
-
342
-
343
-
344
-
345
-
346
-
347
-
348
-
349
-
350
-
351
-
352
-
353
-
354
-
355
-
356
-
357
-
358
-
359
-
360
-
361
-
362
-
363
-
364
-
365
-
366
-
367
-
368
-
369
-
370
-
371
-
372
-
373
-
374
-
375
-
376
-
377
-
378
-
379
-
380
-
381
-
382
-
383
-
384
-
385
-
386
-
387
-
388
-
389
-
390
 |
 |

RBS Group Annual Report and Accounts 200994
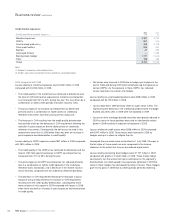
2009 compared with 2008
Operating profit improved to £5,709 million in 2009, compared with an
operating loss of £1,796 million in 2008. Although the buoyant market
conditions experienced in the first quarter levelled off over the course of
the year, the refocusing of the business on its core franchises was
successful. GBM has tightened its balance sheet management over the
course of the year, with disciplined deployment of capital to support its
targeted client base.
In an often volatile market environment, GBM responded quickly to its
clients’ needs to strengthen their balance sheets and to take advantage
of the attractive environment for debt and equity issues. RBS
participated in the five largest equity issues worldwide in 2009, and in
six out of the ten largest debt capital markets transactions.
Income grew significantly, reflecting a very strong first quarter benefiting
from market volatility, client activity and a marked improvement from
Credit Markets. Rates flow business, up 127%, benefited from good
client activity, while strong equity capital markets drove a fourfold
increase in Equities.
Portfolio management and origination grew 39% as financial institutions
and corporate clients refinanced through the debt capital markets. The
refocused Credit Markets delivered a much improved result from greater
liquidity and a more positive trading environment.
Despite quarterly movement in the Group’s credit spreads, overall
spreads remained broadly flat over the year resulting in a small loss
from movements in the fair value of own debt compared with a £357
million gain in 2008.
Expenses increased 17%, reflecting higher performance-related costs
and the impact of adverse exchange rate movements, partly offset by
restructuring and efficiency benefits. Less than half of the change in
staff costs related to increases in 2009 bonus awards.
Staff costs represented 27% of income. The Group introduced new
deferral policies in 2009, which have led to changes in accrual patterns.
Adjusting for both 2008 and 2009 deferrals, GBM’s compensation ratio
in 2009 would have been 28%.
Higher impairments principally reflected a large individual failure
recognised in the third quarter. Impairments represented 0.59% of loans
and advances to customers compared with 0.29% in the prior year,
reflecting the marked reduction in loans and advances.
Total third party assets, excluding derivatives, were down 17%, or 13%
at constant exchange rates, compared with 31 December 2008, driven
by a 43% reduction in loans and advances as customers took
advantage of favourable capital market conditions to raise alternative
forms of finance to bank debt. This reduction was partially offset by an
increase in liquid assets.
Risk-weighted assets decreased 19%, or 15% at constant exchange
rates, reflecting the fall in third party assets and the Group’s continued
focus on reducing its risk profile and balance sheet usage.
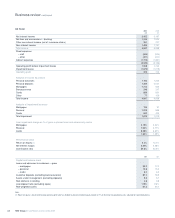
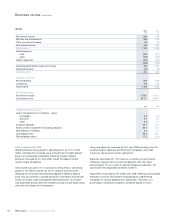
Global Banking & Markets continued
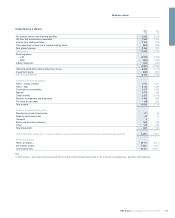
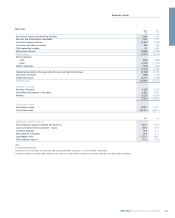
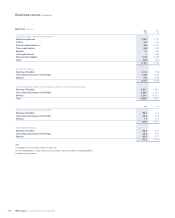
2009 2008
£bn £bn
Capital and balance sheet
Loans and advances (including banks) 127.8 224.2
Reverse repos 73.3 88.8
Securities 106.0 127.5
Cash and eligible bills 74.0 20.2
Other assets 31.1 38.0
Total third party assets (excluding derivatives mark to market) 412.2 498.7
Net derivative assets (after netting) 68.0 121.0
Customer deposits (excluding repos) 46.9 87.8
Risk elements in lending 1.8 0.9
Loan:deposit ratio 194% 192%
Risk-weighted assets 123.7 151.8
Business review continued