RBS 2009 Annual Report Download - page 315
Download and view the complete annual report
Please find page 315 of the 2009 RBS annual report below. You can navigate through the pages in the report by either clicking on the pages listed below, or by using the keyword search tool below to find specific information within the annual report.-
 1
1 -
2
-
3
-
4
-
5
-
6
-
7
-
8
-
9
-
10
-
11
-
12
-
13
-
14
-
15
-
16
-
17
-
18
-
19
-
20
-
21
-
22
-
23
-
24
-
25
-
26
-
27
-
28
-
29
-
30
-
31
-
32
-
33
-
34
-
35
-
36
-
37
-
38
-
39
-
40
-
41
-
42
-
43
-
44
-
45
-
46
-
47
-
48
-
49
-
50
-
51
-
52
-
53
-
54
-
55
-
56
-
57
-
58
-
59
-
60
-
61
-
62
-
63
-
64
-
65
-
66
-
67
-
68
-
69
-
70
-
71
-
72
-
73
-
74
-
75
-
76
-
77
-
78
-
79
-
80
-
81
-
82
-
83
-
84
-
85
-
86
-
87
-
88
-
89
-
90
-
91
-
92
-
93
-
94
-
95
-
96
-
97
-
98
-
99
-
100
-
101
-
102
-
103
-
104
-
105
-
106
-
107
-
108
-
109
-
110
-
111
-
112
-
113
-
114
-
115
-
116
-
117
-
118
-
119
-
120
-
121
-
122
-
123
-
124
-
125
-
126
-
127
-
128
-
129
-
130
-
131
-
132
-
133
-
134
-
135
-
136
-
137
-
138
-
139
-
140
-
141
-
142
-
143
-
144
-
145
-
146
-
147
-
148
-
149
-
150
-
151
-
152
-
153
-
154
-
155
-
156
-
157
-
158
-
159
-
160
-
161
-
162
-
163
-
164
-
165
-
166
-
167
-
168
-
169
-
170
-
171
-
172
-
173
-
174
-
175
-
176
-
177
-
178
-
179
-
180
-
181
-
182
-
183
-
184
-
185
-
186
-
187
-
188
-
189
-
190
-
191
-
192
-
193
-
194
-
195
-
196
-
197
-
198
-
199
-
200
-
201
-
202
-
203
-
204
-
205
-
206
-
207
-
208
-
209
-
210
-
211
-
212
-
213
-
214
-
215
-
216
-
217
-
218
-
219
-
220
-
221
-
222
-
223
-
224
-
225
-
226
-
227
-
228
-
229
-
230
-
231
-
232
-
233
-
234
-
235
-
236
-
237
-
238
-
239
-
240
-
241
-
242
-
243
-
244
-
245
-
246
-
247
-
248
-
249
-
250
-
251
-
252
-
253
-
254
-
255
-
256
-
257
-
258
-
259
-
260
-
261
-
262
-
263
-
264
-
265
-
266
-
267
-
268
-
269
-
270
-
271
-
272
-
273
-
274
-
275
-
276
-
277
-
278
-
279
-
280
-
281
-
282
-
283
-
284
-
285
-
286
-
287
-
288
-
289
-
290
-
291
-
292
-
293
-
294
-
295
-
296
-
297
-
298
-
299
-
300
-
301
-
302
-
303
-
304
-
 305
305 -
 306
306 -
 307
307 -
 308
308 -
 309
309 -
 310
310 -
 311
311 -
 312
312 -
 313
313 -
 314
314 -
 315
315 -
 316
316 -
 317
317 -
 318
318 -
 319
319 -
 320
320 -
 321
321 -
 322
322 -
 323
323 -
 324
324 -
 325
325 -
326
-
327
-
328
-
329
-
330
-
331
-
332
-
333
-
334
-
335
-
336
-
337
-
338
-
339
-
340
-
341
-
342
-
343
-
344
-
345
-
346
-
347
-
348
-
349
-
350
-
351
-
352
-
353
-
354
-
355
-
356
-
357
-
358
-
359
-
360
-
361
-
362
-
363
-
364
-
365
-
366
-
367
-
368
-
369
-
370
-
371
-
372
-
373
-
374
-
375
-
376
-
377
-
378
-
379
-
380
-
381
-
382
-
383
-
384
-
385
-
386
-
387
-
388
-
389
-
390
 |
 |

313RBS Group Annual Report and Accounts 2009
Financial statements
Notes on the accounts
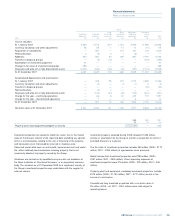
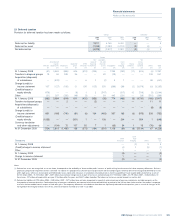
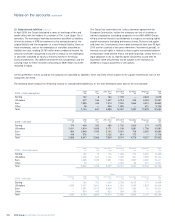
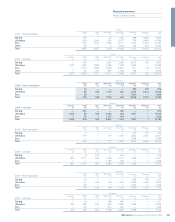
Accident year
2001 2002 2003 2004 2005 2006 2007 2008 2009 Total
Insurance claims – gross £m £m £m £m £m £m £m £m £m £m
Estimate of ultimate
claims costs:
At end of accident year 2,395 3,013 3,658 3,710 4,265 4,269 4,621 4,080 4,383 34,394
One year later (70) 91 (140) (186) (92) (275) (71) 29 (714)
Two years later 20 1 (106) (88) (147) (77) (5) (402)
Three years later 12 (12) (55) (85) (60) (16) (216)
Four years later (40) (17) (47) (31) (55) (190)
Five years later (1) (19) (21) — (41)
Six years later (9) (11) (32) (52)
Seven years later 6 (14) (8)
Eight years later 4 4
Current estimate of
cumulative claims 2,317 3,032 3,257 3,320 3,911 3,901 4,545 4,109 4,383 32,775
Cumulative payments
to date (2,247) (2,961) (3,110) (3,080) (3,582) (3,316) (3,716) (2,995) (2,179) (27,186)
70 71 147 240 329 585 829 1,114 2,204 5,589
Liability in respect of earlier years 109
Claims handling costs 104
Gross general insurance claims liability 5,802
Insurance risk
Insurance risk is the risk of fluctuations in the timing, frequency or
severity of insured events, relative to the expectations of the Group at
the time of underwriting.
Underwriting and pricing risk
The Group manages underwriting and pricing risk through the use of
underwriting guidelines which detail the class, nature and type of
business that may be accepted; pricing policies by product line and by
brand; and centralised control of policy wordings and any subsequent
changes.
Claims management risk
The risk that claims are handled or paid inappropriately is managed
using a range of IT system controls and manual processes conducted
by experienced staff. These, together with a range of detailed policies
and procedures ensure that all claims are handled in a timely,
appropriate and accurate manner.
Reinsurance risk
Reinsurance is used to protect against the impact of major catastrophic
events or unforeseen volumes of, or adverse trends in, large individual
claims and to transfer risk that is outside the Group’s current risk
appetite.
Reinsurance of risks above the Group’s risk appetite is only effective if
the reinsurance premium is economic and the counterparty is financially
secure. Acceptable reinsurers are rated A- or better unless specifically
authorised.
Reserving risk
Reserving risk relates to both premiums and claims. It is the risk that
reserves are assessed incorrectly such that insufficient funds have been
retained to pay or handle claims as the amounts fall due. Claims
development data provides information on the historical pattern of
reserving risk.