RBS 2009 Annual Report Download - page 185
Download and view the complete annual report
Please find page 185 of the 2009 RBS annual report below. You can navigate through the pages in the report by either clicking on the pages listed below, or by using the keyword search tool below to find specific information within the annual report.-
 1
1 -
2
-
3
-
4
-
5
-
6
-
7
-
8
-
9
-
10
-
11
-
12
-
13
-
14
-
15
-
16
-
17
-
18
-
19
-
20
-
21
-
22
-
23
-
24
-
25
-
26
-
27
-
28
-
29
-
30
-
31
-
32
-
33
-
34
-
35
-
36
-
37
-
38
-
39
-
40
-
41
-
42
-
43
-
44
-
45
-
46
-
47
-
48
-
49
-
50
-
51
-
52
-
53
-
54
-
55
-
56
-
57
-
58
-
59
-
60
-
61
-
62
-
63
-
64
-
65
-
66
-
67
-
68
-
69
-
70
-
71
-
72
-
73
-
74
-
75
-
76
-
77
-
78
-
79
-
80
-
81
-
82
-
83
-
84
-
85
-
86
-
87
-
88
-
89
-
90
-
91
-
92
-
93
-
94
-
95
-
96
-
97
-
98
-
99
-
100
-
101
-
102
-
103
-
104
-
105
-
106
-
107
-
108
-
109
-
110
-
111
-
112
-
113
-
114
-
115
-
116
-
117
-
118
-
119
-
120
-
121
-
122
-
123
-
124
-
125
-
126
-
127
-
128
-
129
-
130
-
131
-
132
-
133
-
134
-
135
-
136
-
137
-
138
-
139
-
140
-
141
-
142
-
143
-
144
-
145
-
146
-
147
-
148
-
149
-
150
-
151
-
152
-
153
-
154
-
155
-
156
-
157
-
158
-
159
-
160
-
161
-
162
-
163
-
164
-
165
-
166
-
167
-
168
-
169
-
170
-
171
-
172
-
173
-
174
-
 175
175 -
 176
176 -
 177
177 -
 178
178 -
 179
179 -
 180
180 -
 181
181 -
 182
182 -
 183
183 -
 184
184 -
 185
185 -
 186
186 -
 187
187 -
 188
188 -
 189
189 -
 190
190 -
 191
191 -
 192
192 -
 193
193 -
 194
194 -
 195
195 -
196
-
197
-
198
-
199
-
200
-
201
-
202
-
203
-
204
-
205
-
206
-
207
-
208
-
209
-
210
-
211
-
212
-
213
-
214
-
215
-
216
-
217
-
218
-
219
-
220
-
221
-
222
-
223
-
224
-
225
-
226
-
227
-
228
-
229
-
230
-
231
-
232
-
233
-
234
-
235
-
236
-
237
-
238
-
239
-
240
-
241
-
242
-
243
-
244
-
245
-
246
-
247
-
248
-
249
-
250
-
251
-
252
-
253
-
254
-
255
-
256
-
257
-
258
-
259
-
260
-
261
-
262
-
263
-
264
-
265
-
266
-
267
-
268
-
269
-
270
-
271
-
272
-
273
-
274
-
275
-
276
-
277
-
278
-
279
-
280
-
281
-
282
-
283
-
284
-
285
-
286
-
287
-
288
-
289
-
290
-
291
-
292
-
293
-
294
-
295
-
296
-
297
-
298
-
299
-
300
-
301
-
302
-
303
-
304
-
305
-
306
-
307
-
308
-
309
-
310
-
311
-
312
-
313
-
314
-
315
-
316
-
317
-
318
-
319
-
320
-
321
-
322
-
323
-
324
-
325
-
326
-
327
-
328
-
329
-
330
-
331
-
332
-
333
-
334
-
335
-
336
-
337
-
338
-
339
-
340
-
341
-
342
-
343
-
344
-
345
-
346
-
347
-
348
-
349
-
350
-
351
-
352
-
353
-
354
-
355
-
356
-
357
-
358
-
359
-
360
-
361
-
362
-
363
-
364
-
365
-
366
-
367
-
368
-
369
-
370
-
371
-
372
-
373
-
374
-
375
-
376
-
377
-
378
-
379
-
380
-
381
-
382
-
383
-
384
-
385
-
386
-
387
-
388
-
389
-
390
 |
 |

Business review
Risk, capital and liquidity management
183RBS Group Annual Report and Accounts 2009
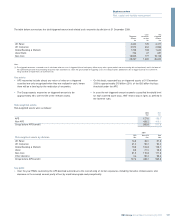
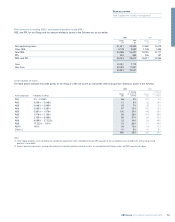
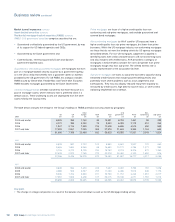
Risk elements in lending (REIL) and potential problem loans (PPL)
REIL and PPL for the Group and the amount relating to assets in the Scheme are set out below.
2009 2008
Group APS Group APS
£m £m £m £m
Non-performing loans 31,811 22,335 17,082 12,679
Other REIL 3,178 2,092 1,709 1,498
Total REIL 34,989 24,427 18,791 14,177
PPL 924 580 226 187
REIL and PPL 35,913 25,007 19,017 14,364
Core 12,361 7,170
Non-Core 23,552 17,837
35,913 25,007
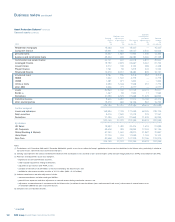
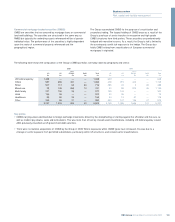
Credit quality of loans
The table below analyses the credit quality of the Group’s credit risk assets by risk bands and the proportion relating to assets in the Scheme.
2009 2008
% relating % relating
Group to assets in Group to assets in
Asset quality band Probability of default £bn scheme £bn scheme
AQ1 0% – 0.034% 95 2% 127 3%
AQ2 0.034% – 0.048% 12 9% 26 16%
AQ3 0.048% – 0.095% 29 7% 38 17%
AQ4 0.095% – 0.381% 97 12% 150 15%
AQ5 0.381% – 1.076% 130 24% 148 28%
AQ6 1.076% – 2.153% 95 28% 103 36%
AQ7 2.153% – 6.089% 55 37% 46 52%
AQ8 6.089% - 17.222% 23 44% 26 46%
AQ9 17.222% - 100% 15 66% 12 69%
AQ10 100% 38 76% 18 72%
Other (1) 41 5% 41 8%
630 23% 735 24%
Notes:
(1) ‘Other’ largely comprises assets covered by the standardised approach for which a probability of default (PD) equivalent to those assigned to assets covered by the internal ratings based
approach is not available.
(2) Reverse repurchase agreements, carrying value relating to net derivative positions and debt securities are excluded from both Group numbers and APS covered assets above.