RBS 2009 Annual Report Download - page 42
Download and view the complete annual report
Please find page 42 of the 2009 RBS annual report below. You can navigate through the pages in the report by either clicking on the pages listed below, or by using the keyword search tool below to find specific information within the annual report.-
 1
1 -
2
-
3
-
4
-
5
-
6
-
7
-
8
-
9
-
10
-
11
-
12
-
13
-
14
-
15
-
16
-
17
-
18
-
19
-
20
-
21
-
22
-
23
-
24
-
25
-
26
-
27
-
28
-
29
-
30
-
31
-
 32
32 -
 33
33 -
 34
34 -
 35
35 -
 36
36 -
 37
37 -
 38
38 -
 39
39 -
 40
40 -
 41
41 -
 42
42 -
 43
43 -
 44
44 -
 45
45 -
 46
46 -
 47
47 -
 48
48 -
 49
49 -
 50
50 -
 51
51 -
 52
52 -
53
-
54
-
55
-
56
-
57
-
58
-
59
-
60
-
61
-
62
-
63
-
64
-
65
-
66
-
67
-
68
-
69
-
70
-
71
-
72
-
73
-
74
-
75
-
76
-
77
-
78
-
79
-
80
-
81
-
82
-
83
-
84
-
85
-
86
-
87
-
88
-
89
-
90
-
91
-
92
-
93
-
94
-
95
-
96
-
97
-
98
-
99
-
100
-
101
-
102
-
103
-
104
-
105
-
106
-
107
-
108
-
109
-
110
-
111
-
112
-
113
-
114
-
115
-
116
-
117
-
118
-
119
-
120
-
121
-
122
-
123
-
124
-
125
-
126
-
127
-
128
-
129
-
130
-
131
-
132
-
133
-
134
-
135
-
136
-
137
-
138
-
139
-
140
-
141
-
142
-
143
-
144
-
145
-
146
-
147
-
148
-
149
-
150
-
151
-
152
-
153
-
154
-
155
-
156
-
157
-
158
-
159
-
160
-
161
-
162
-
163
-
164
-
165
-
166
-
167
-
168
-
169
-
170
-
171
-
172
-
173
-
174
-
175
-
176
-
177
-
178
-
179
-
180
-
181
-
182
-
183
-
184
-
185
-
186
-
187
-
188
-
189
-
190
-
191
-
192
-
193
-
194
-
195
-
196
-
197
-
198
-
199
-
200
-
201
-
202
-
203
-
204
-
205
-
206
-
207
-
208
-
209
-
210
-
211
-
212
-
213
-
214
-
215
-
216
-
217
-
218
-
219
-
220
-
221
-
222
-
223
-
224
-
225
-
226
-
227
-
228
-
229
-
230
-
231
-
232
-
233
-
234
-
235
-
236
-
237
-
238
-
239
-
240
-
241
-
242
-
243
-
244
-
245
-
246
-
247
-
248
-
249
-
250
-
251
-
252
-
253
-
254
-
255
-
256
-
257
-
258
-
259
-
260
-
261
-
262
-
263
-
264
-
265
-
266
-
267
-
268
-
269
-
270
-
271
-
272
-
273
-
274
-
275
-
276
-
277
-
278
-
279
-
280
-
281
-
282
-
283
-
284
-
285
-
286
-
287
-
288
-
289
-
290
-
291
-
292
-
293
-
294
-
295
-
296
-
297
-
298
-
299
-
300
-
301
-
302
-
303
-
304
-
305
-
306
-
307
-
308
-
309
-
310
-
311
-
312
-
313
-
314
-
315
-
316
-
317
-
318
-
319
-
320
-
321
-
322
-
323
-
324
-
325
-
326
-
327
-
328
-
329
-
330
-
331
-
332
-
333
-
334
-
335
-
336
-
337
-
338
-
339
-
340
-
341
-
342
-
343
-
344
-
345
-
346
-
347
-
348
-
349
-
350
-
351
-
352
-
353
-
354
-
355
-
356
-
357
-
358
-
359
-
360
-
361
-
362
-
363
-
364
-
365
-
366
-
367
-
368
-
369
-
370
-
371
-
372
-
373
-
374
-
375
-
376
-
377
-
378
-
379
-
380
-
381
-
382
-
383
-
384
-
385
-
386
-
387
-
388
-
389
-
390
 |
 |

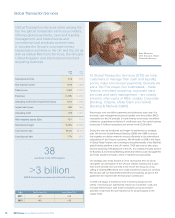
RBS Group Annual Report and Accounts 200940
Non-Core Division & APS
Nathan Bostock
Head of
Restructuring & Risk
MFor biographies
see pages 8-11
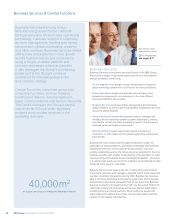
Our Non-Core Division is central to the strategy
that will return RBS to self-sufficiency.
On the one hand, it is managing assets that are no longer core to our
strategy and the continuing operations of RBS, and which we plan to sell
or to run down. On the other, partly because Non-Core will reduce the
asset side of our balance sheet, it will improve our funding position and
make RBS a safer bank. Non-Core Division was created to facilitate the
re-shaping of RBS on its journey to self-sufficiency and is responsible for
one of the largest bank restructurings being undertaken globally and
one of the largest in history.
The Asset Protection Scheme (APS) is also vital to our plans. It is a
credit protection scheme. It gives us protection, similar to an insurance
policy, against future losses in the event that the economy enters a
further, severe and prolonged downturn.
We manage Non-Core & APS together, under the leadership of
Nathan Bostock and Rory Cullinan, who joined us during the year.
We have structured Non-Core Division & APS into three key business
areas.
•Portfolio & Banking is responsible for the wholesale banking assets
transferred from GBM and accounts for the largest percentage of the
assets in Non-Core.
•International Businesses & Portfolios manages assets and includes
the retail and commercial businesses identified as non-core, the
countries we are exiting to reduce our geographic footprint, and
portfolios primarily transferred from our UK Corporate Banking
Division, Ulster Bank and Citizens. It is the largest employer in the
division with almost 13,000 employees globally.
•Non-Core Markets includes trading assets from GBM, principally
our exotic credit derivatives, monoline and asset-backed securities
positions and is responsible for the most volatile assets placed in
Non-Core Division.
In addition, we have a small number of standalone businesses, such
as Aviation Capital.
Non-Core Division manages separately assets
that the Group intends to run off or dispose.
The Division contains a range of businesses
and asset portfolios primarily from GBM,
including RBS Sempra Commodities, linked to
proprietary trading, higher risk profile asset
portfolios including excess risk concentrations,
and other illiquid portfolios. It also includes a
number of portfolios and businesses, including
regional markets businesses, that the Group
has concluded are no longer strategic.
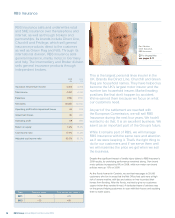
2009 2008
£m £m
Net interest income from banking activities 1,534 2,156
Non-interest income (3,835) (5,188)
Total income (2,301) (3,032)
Expenses (2,447) (2,683)
Operating loss before other
operating charges & impairment losses (4,748) (5,715)
Insurance net claims (588) (700)
Impairment losses (9,221) (4,936)
Operating loss (14,557) (11,351)
Risk-weighted assets (bn) 171.3bn 170.9bn
Net interest margin 0.69% 0.87%
Cost:income ratio (106.3%) (88.5%)
Loan:deposit ratio 1,121% 683%
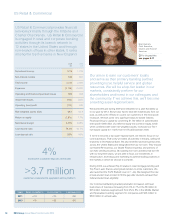
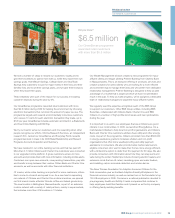
£56.9 billion
decline in Third Party Assets, excluding derivatives
£12.6 billion
of disposals during the year