RBS 2009 Annual Report Download - page 168
Download and view the complete annual report
Please find page 168 of the 2009 RBS annual report below. You can navigate through the pages in the report by either clicking on the pages listed below, or by using the keyword search tool below to find specific information within the annual report.-
 1
1 -
2
-
3
-
4
-
5
-
6
-
7
-
8
-
9
-
10
-
11
-
12
-
13
-
14
-
15
-
16
-
17
-
18
-
19
-
20
-
21
-
22
-
23
-
24
-
25
-
26
-
27
-
28
-
29
-
30
-
31
-
32
-
33
-
34
-
35
-
36
-
37
-
38
-
39
-
40
-
41
-
42
-
43
-
44
-
45
-
46
-
47
-
48
-
49
-
50
-
51
-
52
-
53
-
54
-
55
-
56
-
57
-
58
-
59
-
60
-
61
-
62
-
63
-
64
-
65
-
66
-
67
-
68
-
69
-
70
-
71
-
72
-
73
-
74
-
75
-
76
-
77
-
78
-
79
-
80
-
81
-
82
-
83
-
84
-
85
-
86
-
87
-
88
-
89
-
90
-
91
-
92
-
93
-
94
-
95
-
96
-
97
-
98
-
99
-
100
-
101
-
102
-
103
-
104
-
105
-
106
-
107
-
108
-
109
-
110
-
111
-
112
-
113
-
114
-
115
-
116
-
117
-
118
-
119
-
120
-
121
-
122
-
123
-
124
-
125
-
126
-
127
-
128
-
129
-
130
-
131
-
132
-
133
-
134
-
135
-
136
-
137
-
138
-
139
-
140
-
141
-
142
-
143
-
144
-
145
-
146
-
147
-
148
-
149
-
150
-
151
-
152
-
153
-
154
-
155
-
156
-
157
-
 158
158 -
 159
159 -
 160
160 -
 161
161 -
 162
162 -
 163
163 -
 164
164 -
 165
165 -
 166
166 -
 167
167 -
 168
168 -
 169
169 -
 170
170 -
 171
171 -
 172
172 -
 173
173 -
 174
174 -
 175
175 -
 176
176 -
 177
177 -
 178
178 -
179
-
180
-
181
-
182
-
183
-
184
-
185
-
186
-
187
-
188
-
189
-
190
-
191
-
192
-
193
-
194
-
195
-
196
-
197
-
198
-
199
-
200
-
201
-
202
-
203
-
204
-
205
-
206
-
207
-
208
-
209
-
210
-
211
-
212
-
213
-
214
-
215
-
216
-
217
-
218
-
219
-
220
-
221
-
222
-
223
-
224
-
225
-
226
-
227
-
228
-
229
-
230
-
231
-
232
-
233
-
234
-
235
-
236
-
237
-
238
-
239
-
240
-
241
-
242
-
243
-
244
-
245
-
246
-
247
-
248
-
249
-
250
-
251
-
252
-
253
-
254
-
255
-
256
-
257
-
258
-
259
-
260
-
261
-
262
-
263
-
264
-
265
-
266
-
267
-
268
-
269
-
270
-
271
-
272
-
273
-
274
-
275
-
276
-
277
-
278
-
279
-
280
-
281
-
282
-
283
-
284
-
285
-
286
-
287
-
288
-
289
-
290
-
291
-
292
-
293
-
294
-
295
-
296
-
297
-
298
-
299
-
300
-
301
-
302
-
303
-
304
-
305
-
306
-
307
-
308
-
309
-
310
-
311
-
312
-
313
-
314
-
315
-
316
-
317
-
318
-
319
-
320
-
321
-
322
-
323
-
324
-
325
-
326
-
327
-
328
-
329
-
330
-
331
-
332
-
333
-
334
-
335
-
336
-
337
-
338
-
339
-
340
-
341
-
342
-
343
-
344
-
345
-
346
-
347
-
348
-
349
-
350
-
351
-
352
-
353
-
354
-
355
-
356
-
357
-
358
-
359
-
360
-
361
-
362
-
363
-
364
-
365
-
366
-
367
-
368
-
369
-
370
-
371
-
372
-
373
-
374
-
375
-
376
-
377
-
378
-
379
-
380
-
381
-
382
-
383
-
384
-
385
-
386
-
387
-
388
-
389
-
390
 |
 |

Business review continued
RBS Group Annual Report and Accounts 2009166
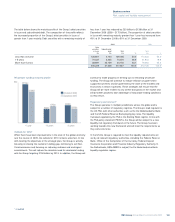
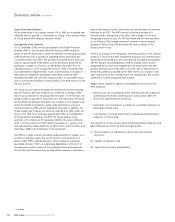
Percent increase/(decrease)
in CFG EVE(1)
2% parallel 2% parallel
upward downward
movement movement
in US in US
interest rates interest rates(2)
Period end (4.3) (23.4)
Maximum (4.3) (24.6)
Minimum 4.6 (18.4)
Average (0.8) (22.2)
Notes:
(1) Economic value of equity is the net present value (NPV) of assets and liabilities calculated by discounting expected cash flows of each instrument over its expected life. Risk to EVE is quantified
by calculating the impact of interest rate changes on the net present value of equity and is expressed as a percentage of CFG regulatory capital.
(2) No negative rates allowed.
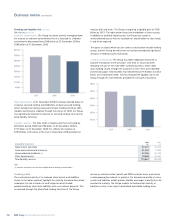
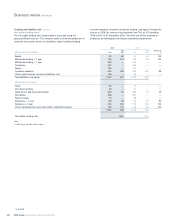
Sensitivity of net interest income*
There have been no material changes to the Group’s measurement of,
and management philosophy towards, sensitivity of net interest income
to movement in interest rates. The Group aims to be relatively neutral to
directional shifts in interest rates. It seeks to mitigate the effect of
prospective interest movements which could reduce future net interest
income, whilst balancing the cost of such hedging activities on the
current net revenue stream.
The following table shows the sensitivity of net interest income over
the next twelve months to an immediate up and down 1% change to all
interest rates.
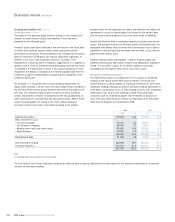
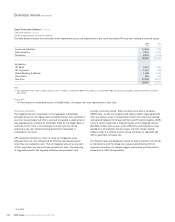
Market risk continued
Structural interest rate risk continued
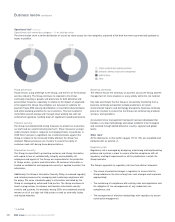
Citizens Economic Value of Equity (EVE)*
Generally, Citizens is the main contributor to overall non-trading interest
rate VaR. Citizens aims, through its management of market risk in non-
trading portfolios, to mitigate the effect of prospective interest
movements which could reduce future net interest income, whilst
balancing the cost of such hedging activities on the current net revenue
stream. To do so it uses a variety of income simulation and valuation risk
measures that more effectively capture the risk to earnings due to
mortgage prepayment and competitive deposit pricing behaviour than a
VaR-based methodology. IRRBB is managed within approved limits on
interest rate risk, liquidity and capitalisation, with a goal of optimising
yield.
In addition to net interest income sensitivity Citizens also measures the
sensitivity of the value of the net interest margin to changes in interest
rates on a monthly basis. This measure is called EVE sensitivity. The
table below details this sensitivity at the end of 2009 and the maximum
and minimum month-end figures.
2009 2008
£m £m
+ 100bp shift in yield curves 510 139
– 100bp shift in yield curves (687) (234)
The base case projected net interest income is based on the Group’s
current balance sheet, forwards rate paths implied by the yield curve as
at 31 December 2009 and using contractual repricing dates. Where
contractual repricing dates are not held an estimate of the likely timing
and extent of any rate change is used. The projection also includes the
expected effects of behavioural options such as the prepayment of
residential mortgages.
The above sensitivities show how this projected net interest income would
change in response to an immediate parallel shift to all market rates.
The scenarios used are simplified in that they assume all interest rates
for all currencies and maturities move at the same time and by the same
amount and therefore do not reflect the potential effect on net interest
income of some rates changing whilst others remain the same. The
scenarios also do not incorporate actions that would be taken by the
business units to mitigate the effect of this interest rate risk.
The Group’s asset sensitive position has increased in 2009. The primary
contributors to the change are enhanced modelling of embedded
deposit floors, active position management to benefit from the impact of
a tightening US monetary policy regime by Citizens Financial Group and
the impact of not fully hedging the interest rate exposure related to the
APS capital proceeds which were received in late December.
The projections do not take into account the effect on net interest
income of anticipated differences in changes between interest rates
and interest rates linked to other bases (such as central bank rates or
product rates for which the entity has discretion over the timing and
extent of rate changes). The projections make other simplifying
assumptions, including that all positions run to maturity and that there
are no negative interest rates.
* unaudited