RBS 2009 Annual Report Download - page 207
Download and view the complete annual report
Please find page 207 of the 2009 RBS annual report below. You can navigate through the pages in the report by either clicking on the pages listed below, or by using the keyword search tool below to find specific information within the annual report.-
 1
1 -
2
-
3
-
4
-
5
-
6
-
7
-
8
-
9
-
10
-
11
-
12
-
13
-
14
-
15
-
16
-
17
-
18
-
19
-
20
-
21
-
22
-
23
-
24
-
25
-
26
-
27
-
28
-
29
-
30
-
31
-
32
-
33
-
34
-
35
-
36
-
37
-
38
-
39
-
40
-
41
-
42
-
43
-
44
-
45
-
46
-
47
-
48
-
49
-
50
-
51
-
52
-
53
-
54
-
55
-
56
-
57
-
58
-
59
-
60
-
61
-
62
-
63
-
64
-
65
-
66
-
67
-
68
-
69
-
70
-
71
-
72
-
73
-
74
-
75
-
76
-
77
-
78
-
79
-
80
-
81
-
82
-
83
-
84
-
85
-
86
-
87
-
88
-
89
-
90
-
91
-
92
-
93
-
94
-
95
-
96
-
97
-
98
-
99
-
100
-
101
-
102
-
103
-
104
-
105
-
106
-
107
-
108
-
109
-
110
-
111
-
112
-
113
-
114
-
115
-
116
-
117
-
118
-
119
-
120
-
121
-
122
-
123
-
124
-
125
-
126
-
127
-
128
-
129
-
130
-
131
-
132
-
133
-
134
-
135
-
136
-
137
-
138
-
139
-
140
-
141
-
142
-
143
-
144
-
145
-
146
-
147
-
148
-
149
-
150
-
151
-
152
-
153
-
154
-
155
-
156
-
157
-
158
-
159
-
160
-
161
-
162
-
163
-
164
-
165
-
166
-
167
-
168
-
169
-
170
-
171
-
172
-
173
-
174
-
175
-
176
-
177
-
178
-
179
-
180
-
181
-
182
-
183
-
184
-
185
-
186
-
187
-
188
-
189
-
190
-
191
-
192
-
193
-
194
-
195
-
196
-
 197
197 -
 198
198 -
 199
199 -
 200
200 -
 201
201 -
 202
202 -
 203
203 -
 204
204 -
 205
205 -
 206
206 -
 207
207 -
 208
208 -
 209
209 -
 210
210 -
 211
211 -
 212
212 -
 213
213 -
 214
214 -
 215
215 -
 216
216 -
 217
217 -
218
-
219
-
220
-
221
-
222
-
223
-
224
-
225
-
226
-
227
-
228
-
229
-
230
-
231
-
232
-
233
-
234
-
235
-
236
-
237
-
238
-
239
-
240
-
241
-
242
-
243
-
244
-
245
-
246
-
247
-
248
-
249
-
250
-
251
-
252
-
253
-
254
-
255
-
256
-
257
-
258
-
259
-
260
-
261
-
262
-
263
-
264
-
265
-
266
-
267
-
268
-
269
-
270
-
271
-
272
-
273
-
274
-
275
-
276
-
277
-
278
-
279
-
280
-
281
-
282
-
283
-
284
-
285
-
286
-
287
-
288
-
289
-
290
-
291
-
292
-
293
-
294
-
295
-
296
-
297
-
298
-
299
-
300
-
301
-
302
-
303
-
304
-
305
-
306
-
307
-
308
-
309
-
310
-
311
-
312
-
313
-
314
-
315
-
316
-
317
-
318
-
319
-
320
-
321
-
322
-
323
-
324
-
325
-
326
-
327
-
328
-
329
-
330
-
331
-
332
-
333
-
334
-
335
-
336
-
337
-
338
-
339
-
340
-
341
-
342
-
343
-
344
-
345
-
346
-
347
-
348
-
349
-
350
-
351
-
352
-
353
-
354
-
355
-
356
-
357
-
358
-
359
-
360
-
361
-
362
-
363
-
364
-
365
-
366
-
367
-
368
-
369
-
370
-
371
-
372
-
373
-
374
-
375
-
376
-
377
-
378
-
379
-
380
-
381
-
382
-
383
-
384
-
385
-
386
-
387
-
388
-
389
-
390
 |
 |

Business review
Risk, capital and liquidity management
205RBS Group Annual Report and Accounts 2009
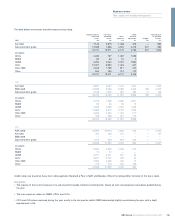
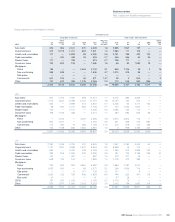
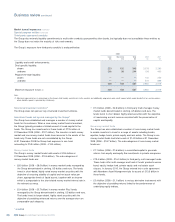
Group exposure to consolidated conduits
CP funded assets
Geographic distribution Credit ratings (S&P equivalent)
Other Weighted Below
UK Europe US RoW Total average AAA AA A BBB BBB
2009 £m £m £m £m £m life years £m £m £m £m £m
Auto loans 476 982 2,621 570 4,649 1.8 2,965 1,547 137 — —
Corporate loans 312 5,213 1,411 865 7,801 1.0 7,584 111 106 — —
Credit card receivables 177 — 3,823 83 4,083 0.8 2,781 759 420 123 —
Trade receivables — 334 438 34 806 0.7 446 266 60 34 —
Student loans 117 — 798 — 915 0.7 798 117 — — —
Consumer loans 733 800 153 — 1,686 1.5 68 50 1,553 15 —
Mortgages:
Prime 138 — — 2,604 2,742 3.1 949 1,746 28 3 16
Non-conforming 599 949 — — 1,548 3.7 1,070 379 99 — —
Sub-prime —————— —————
Commercial 641 194 — 36 871 14.7 25 3 840 — 3
Other 121 670 298 1,176 2,265 2.3 170 249 950 896 —
3,314 9,142 9,542 5,368 27,366 1.9 16,856 5,227 4,193 1,071 19
2008
Auto loans 801 1,706 7,402 398 10,307 1.7 6,075 883 3,349 — —
Corporate loans 1,714 4,347 3,289 2,122 11,472 4.9 10,767 132 573 — —
Credit card receivables 633 — 4,999 212 5,844 0.7 3,465 62 2,171 146 —
Trade receivables 68 922 1,371 384 2,745 0.7 120 1,025 1,600 — —
Student loans 144 — 2,411 — 2,555 0.3 2,296 144 115 — —
Consumer loans 708 1,195 468 — 2,371 1.7 387 993 923 68 —
Mortgages:
Prime — 2,244 — 4,422 6,666 2.8 2,675 3,876 115 — —
Non-conforming 960 1,221 — — 2,181 4.6 351 368 475 987 —
Commercial 713 453 74 495 1,735 11.0 274 518 474 469 —
Other 166 1,198 684 1,933 3,981 1.2 3 958 2,786 234 —
5,907 13,286 20,698 9,966 49,857 3.0 26,413 8,959 12,581 1,904 —
2007
Auto loans 2,250 1,259 4,793 341 8,643 1.9 1,457 3,184 3,940 62 —
Corporate loans 1,127 1,551 4,658 1,627 8,963 6.5 8,838 15 110 — —
Credit card receivables 654 — 4,402 138 5,194 1.0 1,286 913 2,848 147 —
Trade receivables 299 816 1,965 309 3,389 0.9 187 732 2,183 236 51
Student loans 140 — 457 — 597 1.6 270 311 16 — —
Consumer loans 648 724 514 — 1,886 1.2 1,018 473 395 — —
Mortgages:
Prime 276 565 983 4,863 6,687 3.3 1,896 2,181 2,610 — —
Non-conforming 1,675 833 — 69 2,577 5.1 268 1,596 713 — —
Sub-prime — — 9 117 126 0.2 117 — 9 — —
Commercial 1,023 233 198 439 1,893 9.6 746 630 401 116 —
Buy-to-let 61 — — — 61 — 37 24 — — —
CDOs 137 520 1,473 — 2,130 2.7 2,115 15 — — —
Other 579 1,071 1,950 2,323 5,923 2.8 2,362 784 2,652 125 —
8,869 7,572 21,402 10,226 48,069 3.3 20,597 10,858 15,877 686 51