RBS 2009 Annual Report Download - page 267
Download and view the complete annual report
Please find page 267 of the 2009 RBS annual report below. You can navigate through the pages in the report by either clicking on the pages listed below, or by using the keyword search tool below to find specific information within the annual report.-
 1
1 -
2
-
3
-
4
-
5
-
6
-
7
-
8
-
9
-
10
-
11
-
12
-
13
-
14
-
15
-
16
-
17
-
18
-
19
-
20
-
21
-
22
-
23
-
24
-
25
-
26
-
27
-
28
-
29
-
30
-
31
-
32
-
33
-
34
-
35
-
36
-
37
-
38
-
39
-
40
-
41
-
42
-
43
-
44
-
45
-
46
-
47
-
48
-
49
-
50
-
51
-
52
-
53
-
54
-
55
-
56
-
57
-
58
-
59
-
60
-
61
-
62
-
63
-
64
-
65
-
66
-
67
-
68
-
69
-
70
-
71
-
72
-
73
-
74
-
75
-
76
-
77
-
78
-
79
-
80
-
81
-
82
-
83
-
84
-
85
-
86
-
87
-
88
-
89
-
90
-
91
-
92
-
93
-
94
-
95
-
96
-
97
-
98
-
99
-
100
-
101
-
102
-
103
-
104
-
105
-
106
-
107
-
108
-
109
-
110
-
111
-
112
-
113
-
114
-
115
-
116
-
117
-
118
-
119
-
120
-
121
-
122
-
123
-
124
-
125
-
126
-
127
-
128
-
129
-
130
-
131
-
132
-
133
-
134
-
135
-
136
-
137
-
138
-
139
-
140
-
141
-
142
-
143
-
144
-
145
-
146
-
147
-
148
-
149
-
150
-
151
-
152
-
153
-
154
-
155
-
156
-
157
-
158
-
159
-
160
-
161
-
162
-
163
-
164
-
165
-
166
-
167
-
168
-
169
-
170
-
171
-
172
-
173
-
174
-
175
-
176
-
177
-
178
-
179
-
180
-
181
-
182
-
183
-
184
-
185
-
186
-
187
-
188
-
189
-
190
-
191
-
192
-
193
-
194
-
195
-
196
-
197
-
198
-
199
-
200
-
201
-
202
-
203
-
204
-
205
-
206
-
207
-
208
-
209
-
210
-
211
-
212
-
213
-
214
-
215
-
216
-
217
-
218
-
219
-
220
-
221
-
222
-
223
-
224
-
225
-
226
-
227
-
228
-
229
-
230
-
231
-
232
-
233
-
234
-
235
-
236
-
237
-
238
-
239
-
240
-
241
-
242
-
243
-
244
-
245
-
246
-
247
-
248
-
249
-
250
-
251
-
252
-
253
-
254
-
255
-
256
-
 257
257 -
 258
258 -
 259
259 -
 260
260 -
 261
261 -
 262
262 -
 263
263 -
 264
264 -
 265
265 -
 266
266 -
 267
267 -
 268
268 -
 269
269 -
 270
270 -
 271
271 -
 272
272 -
 273
273 -
 274
274 -
 275
275 -
 276
276 -
 277
277 -
278
-
279
-
280
-
281
-
282
-
283
-
284
-
285
-
286
-
287
-
288
-
289
-
290
-
291
-
292
-
293
-
294
-
295
-
296
-
297
-
298
-
299
-
300
-
301
-
302
-
303
-
304
-
305
-
306
-
307
-
308
-
309
-
310
-
311
-
312
-
313
-
314
-
315
-
316
-
317
-
318
-
319
-
320
-
321
-
322
-
323
-
324
-
325
-
326
-
327
-
328
-
329
-
330
-
331
-
332
-
333
-
334
-
335
-
336
-
337
-
338
-
339
-
340
-
341
-
342
-
343
-
344
-
345
-
346
-
347
-
348
-
349
-
350
-
351
-
352
-
353
-
354
-
355
-
356
-
357
-
358
-
359
-
360
-
361
-
362
-
363
-
364
-
365
-
366
-
367
-
368
-
369
-
370
-
371
-
372
-
373
-
374
-
375
-
376
-
377
-
378
-
379
-
380
-
381
-
382
-
383
-
384
-
385
-
386
-
387
-
388
-
389
-
390
 |
 |

Financial statements
Notes on the accounts
265RBS Group Annual Report and Accounts 2009
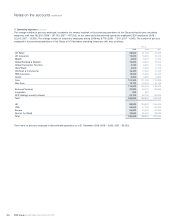
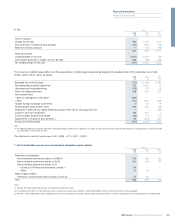
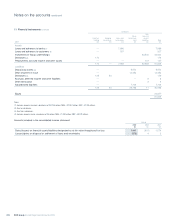
Curtailment gains of £2,148 million have been recognised in 2009
arising from changes to pension benefits in the Main scheme and
certain other subsidiaries schemes due to the capping of future salary
increases that will count for pension purposes to the lower of 2% or the
rate of inflation in any year.
At 31 December 2009, ABN AMRO’s principal pension scheme in the
Netherlands had fair value of plan assets of £8,118 million (2008 –
£8,181 million; 2007 – £6,417 million) and present value of defined
benefit obligations of £8,298 million (2008 – £8,589 million; 2007 –
£6,189 million). The principal actuarial assumptions at 31 December
2009 were: discount rate 5.25% (2008 – 5.4%); expected return on plan
assets (weighted average) 5.25% (2008 – 4.7%); rate of increase in
salaries 2.5% (2008 – 2.5%); rate of increase in pensions in payment
2.0% (2008 – 2.0%); and inflation assumption 2.0% (2008 – 2.0%).
The Group expects to contribute £746 million to its defined benefit
pension schemes in 2010 (Main scheme – £414 million). Of the net
liabilities of schemes in deficit, £198 million (2008 – £201 million; 2007 –
£212 million) relates to unfunded schemes.
The most recent funding valuation of the main UK scheme, as at 31
March 2007, showed a surplus of assets over liabilities of £0.7 billion.
The next valuation is due as at 31 March 2010 and the Group expects
this valuation to show that liabilities exceed the value of the assets.
Following this valuation, the Group and scheme Trustees will agree the
level of contributions to be paid to the scheme. This could result in the
amount of contributions payable in 2010 and subsequent years being
materially different from the current rates based on the previous
valuation.
Cumulative net actuarial losses of £4,382 million (2008 – £717 million
losses; 2007 – £1,570 million gains) have been recognised in the
statement of comprehensive income, of which £3,296 million losses
(2008 – £184 million gains; 2007 – £1,579 million gains) relate to the
Main scheme.
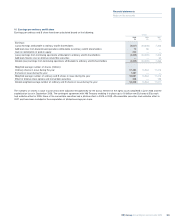
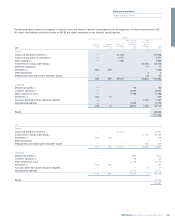
Main scheme All schemes
2009 2008 2007 2006 2005 2009 2008 2007 2006 2005
History of defined benefit schemes £m £m £m £m £m £m £m £m £m £m
Fair value of plan assets 16,603 14,804 18,575 17,374 15,914 27,925 25,756 27,662 18,959 17,388
Present value of defined
benefit obligations 18,675 15,594 18,099 19,004 19,118 30,830 27,752 27,547 20,951 21,123
Net (deficit)/surplus (2,072) (790) 476 (1,630) (3,204) (2,905) (1,996) 115 (1,992) (3,735)
Experience gains/(losses)
on plan liabilities 135 (55) (256) (4) (41) 328 (65) (210) (19) (68)
Experience gains/(losses)
on plan assets 993 (4,784) 163 552 1,556 1,344 (6,051) 19 587 1,661
Actual return/(loss) on pension
schemes assets 2,022 (3,513) 1,345 1,574 2,486 2,897 (4,186) 1,413 1,660 2,677
Actual return/(loss) on pension
schemes assets – % 13.8% (19.0%) 7.8% 9.9% 18.4% 11.4% (14.5%) 6.9% 9.6% 18.1%
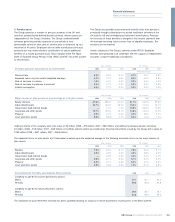
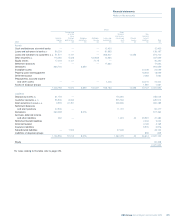
The table below sets out the sensitivities of the pension cost for the year and the present value of defined benefit obligations at the balance sheet
dates to a change in the principal actuarial assumptions:
Main scheme All schemes
Increase/(decrease) Increase/(decrease)
in pension in obligation in pension in obligation
cost for the year at 31 December cost for the year at 31 December
2009 2008 2009 2008 2009 2008 2009 2008
£m £m £m £m £m £m £m £m
0.25% increase in the discount rate (21) (37) (790) (696) (41) (53) (1,261) (1,161)
0.25% increase in inflation 49 77 654 624 93 114 1,143 1,089
0.25% additional rate of increase in pensions in payment 33 41 442 383 47 63 596 695
0.25% additional rate of increase in deferred pensions 16 8214 94 25 15 366 227
0.25% additional rate of increase in salaries 8 28 66 168 17 35 125 219
Longevity increase of 1 year 29 31 416 302 50 50 734 700