RBS 2009 Annual Report Download - page 143
Download and view the complete annual report
Please find page 143 of the 2009 RBS annual report below. You can navigate through the pages in the report by either clicking on the pages listed below, or by using the keyword search tool below to find specific information within the annual report.-
 1
1 -
2
-
3
-
4
-
5
-
6
-
7
-
8
-
9
-
10
-
11
-
12
-
13
-
14
-
15
-
16
-
17
-
18
-
19
-
20
-
21
-
22
-
23
-
24
-
25
-
26
-
27
-
28
-
29
-
30
-
31
-
32
-
33
-
34
-
35
-
36
-
37
-
38
-
39
-
40
-
41
-
42
-
43
-
44
-
45
-
46
-
47
-
48
-
49
-
50
-
51
-
52
-
53
-
54
-
55
-
56
-
57
-
58
-
59
-
60
-
61
-
62
-
63
-
64
-
65
-
66
-
67
-
68
-
69
-
70
-
71
-
72
-
73
-
74
-
75
-
76
-
77
-
78
-
79
-
80
-
81
-
82
-
83
-
84
-
85
-
86
-
87
-
88
-
89
-
90
-
91
-
92
-
93
-
94
-
95
-
96
-
97
-
98
-
99
-
100
-
101
-
102
-
103
-
104
-
105
-
106
-
107
-
108
-
109
-
110
-
111
-
112
-
113
-
114
-
115
-
116
-
117
-
118
-
119
-
120
-
121
-
122
-
123
-
124
-
125
-
126
-
127
-
128
-
129
-
130
-
131
-
132
-
 133
133 -
 134
134 -
 135
135 -
 136
136 -
 137
137 -
 138
138 -
 139
139 -
 140
140 -
 141
141 -
 142
142 -
 143
143 -
 144
144 -
 145
145 -
 146
146 -
 147
147 -
 148
148 -
 149
149 -
 150
150 -
 151
151 -
 152
152 -
 153
153 -
154
-
155
-
156
-
157
-
158
-
159
-
160
-
161
-
162
-
163
-
164
-
165
-
166
-
167
-
168
-
169
-
170
-
171
-
172
-
173
-
174
-
175
-
176
-
177
-
178
-
179
-
180
-
181
-
182
-
183
-
184
-
185
-
186
-
187
-
188
-
189
-
190
-
191
-
192
-
193
-
194
-
195
-
196
-
197
-
198
-
199
-
200
-
201
-
202
-
203
-
204
-
205
-
206
-
207
-
208
-
209
-
210
-
211
-
212
-
213
-
214
-
215
-
216
-
217
-
218
-
219
-
220
-
221
-
222
-
223
-
224
-
225
-
226
-
227
-
228
-
229
-
230
-
231
-
232
-
233
-
234
-
235
-
236
-
237
-
238
-
239
-
240
-
241
-
242
-
243
-
244
-
245
-
246
-
247
-
248
-
249
-
250
-
251
-
252
-
253
-
254
-
255
-
256
-
257
-
258
-
259
-
260
-
261
-
262
-
263
-
264
-
265
-
266
-
267
-
268
-
269
-
270
-
271
-
272
-
273
-
274
-
275
-
276
-
277
-
278
-
279
-
280
-
281
-
282
-
283
-
284
-
285
-
286
-
287
-
288
-
289
-
290
-
291
-
292
-
293
-
294
-
295
-
296
-
297
-
298
-
299
-
300
-
301
-
302
-
303
-
304
-
305
-
306
-
307
-
308
-
309
-
310
-
311
-
312
-
313
-
314
-
315
-
316
-
317
-
318
-
319
-
320
-
321
-
322
-
323
-
324
-
325
-
326
-
327
-
328
-
329
-
330
-
331
-
332
-
333
-
334
-
335
-
336
-
337
-
338
-
339
-
340
-
341
-
342
-
343
-
344
-
345
-
346
-
347
-
348
-
349
-
350
-
351
-
352
-
353
-
354
-
355
-
356
-
357
-
358
-
359
-
360
-
361
-
362
-
363
-
364
-
365
-
366
-
367
-
368
-
369
-
370
-
371
-
372
-
373
-
374
-
375
-
376
-
377
-
378
-
379
-
380
-
381
-
382
-
383
-
384
-
385
-
386
-
387
-
388
-
389
-
390
 |
 |

Business review
Risk, capital and liquidity management
141RBS Group Annual Report and Accounts 2009
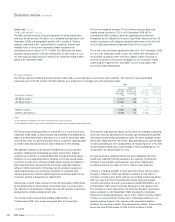
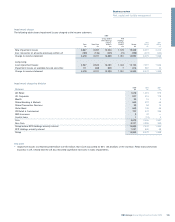
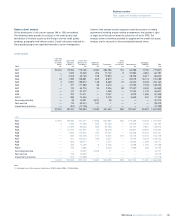
The Group’s exposure to the retail sector was £16.3 billion at
31 December 2009, down 11% on the prior year. The portfolio is well
spread geographically and across sub-sectors.
Economic weakness and reduced consumer confidence is affecting the
sector, with the impact most severe for stores reliant on high
discretionary spend and for smaller retailers. Food retailers generally
fared well during the year, as did the ‘value’ end of the sector in the
context of reduced household spending.
Whilst there has been some flow of retail customers into the GRG, the
total value of debt managed by that team remains low. Economic
conditions are, however, increasingly bringing to light those in the sector
with poor operating models and stretched balance sheets. The more
successful operators continue to adapt their customer proposition,
operating models and capital structure to the new environment whilst
keeping tight control on working capital.
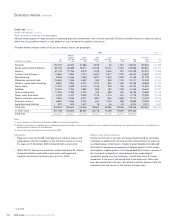
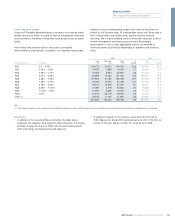
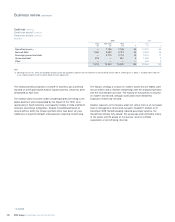
Retail
The Group’s retail portfolio is a component of the wholesale and retail trade industry sector, for which credit risk assets totalled £32 billion at
31 December 2009. Retail comprises £16.3 billion or 51% of the total portfolio, with the remainder being exposure to wholesalers and service-
orientated customers.
2009 2008
Core Non-Core Total Total
Domicile of obligor £m £m £m % £m %
Americas 2,406 146 2,552 15 4,088 22
Central Eastern Europe, Middle East and Africa 394 74 468 3 589 3
UK 6,810 1,180 7,990 49 7,483 41
Other Europe 3,160 1,889 5,049 31 5,531 30
Asia 211 64 275 2 643 4
12,981 3,353 16,334 100 18,334 100
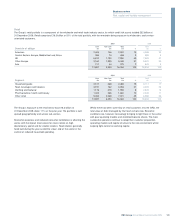
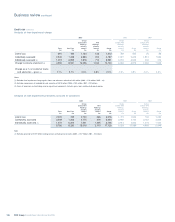
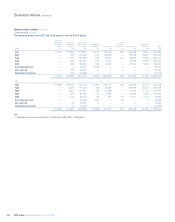
2009 2008
Core Non-Core Total Total
Segment £m £m £m % £m %
Household goods 2,127 338 2,465 15 3,117 17
Food, beverages and tobacco 3,191 162 3,353 21 4,235 23
Clothing and footwear 1,176 379 1,555 9 2,345 13
Pharmaceutical, health and beauty 1,424 236 1,660 10 2,049 11
Other retail 5,063 2,238 7,301 45 6,588 36
12,981 3,353 16,334 100 18,334 100