RBS 2009 Annual Report Download - page 94
Download and view the complete annual report
Please find page 94 of the 2009 RBS annual report below. You can navigate through the pages in the report by either clicking on the pages listed below, or by using the keyword search tool below to find specific information within the annual report.-
 1
1 -
2
-
3
-
4
-
5
-
6
-
7
-
8
-
9
-
10
-
11
-
12
-
13
-
14
-
15
-
16
-
17
-
18
-
19
-
20
-
21
-
22
-
23
-
24
-
25
-
26
-
27
-
28
-
29
-
30
-
31
-
32
-
33
-
34
-
35
-
36
-
37
-
38
-
39
-
40
-
41
-
42
-
43
-
44
-
45
-
46
-
47
-
48
-
49
-
50
-
51
-
52
-
53
-
54
-
55
-
56
-
57
-
58
-
59
-
60
-
61
-
62
-
63
-
64
-
65
-
66
-
67
-
68
-
69
-
70
-
71
-
72
-
73
-
74
-
75
-
76
-
77
-
78
-
79
-
80
-
81
-
82
-
83
-
 84
84 -
 85
85 -
 86
86 -
 87
87 -
 88
88 -
 89
89 -
 90
90 -
 91
91 -
 92
92 -
 93
93 -
 94
94 -
 95
95 -
 96
96 -
 97
97 -
 98
98 -
 99
99 -
 100
100 -
 101
101 -
 102
102 -
 103
103 -
 104
104 -
105
-
106
-
107
-
108
-
109
-
110
-
111
-
112
-
113
-
114
-
115
-
116
-
117
-
118
-
119
-
120
-
121
-
122
-
123
-
124
-
125
-
126
-
127
-
128
-
129
-
130
-
131
-
132
-
133
-
134
-
135
-
136
-
137
-
138
-
139
-
140
-
141
-
142
-
143
-
144
-
145
-
146
-
147
-
148
-
149
-
150
-
151
-
152
-
153
-
154
-
155
-
156
-
157
-
158
-
159
-
160
-
161
-
162
-
163
-
164
-
165
-
166
-
167
-
168
-
169
-
170
-
171
-
172
-
173
-
174
-
175
-
176
-
177
-
178
-
179
-
180
-
181
-
182
-
183
-
184
-
185
-
186
-
187
-
188
-
189
-
190
-
191
-
192
-
193
-
194
-
195
-
196
-
197
-
198
-
199
-
200
-
201
-
202
-
203
-
204
-
205
-
206
-
207
-
208
-
209
-
210
-
211
-
212
-
213
-
214
-
215
-
216
-
217
-
218
-
219
-
220
-
221
-
222
-
223
-
224
-
225
-
226
-
227
-
228
-
229
-
230
-
231
-
232
-
233
-
234
-
235
-
236
-
237
-
238
-
239
-
240
-
241
-
242
-
243
-
244
-
245
-
246
-
247
-
248
-
249
-
250
-
251
-
252
-
253
-
254
-
255
-
256
-
257
-
258
-
259
-
260
-
261
-
262
-
263
-
264
-
265
-
266
-
267
-
268
-
269
-
270
-
271
-
272
-
273
-
274
-
275
-
276
-
277
-
278
-
279
-
280
-
281
-
282
-
283
-
284
-
285
-
286
-
287
-
288
-
289
-
290
-
291
-
292
-
293
-
294
-
295
-
296
-
297
-
298
-
299
-
300
-
301
-
302
-
303
-
304
-
305
-
306
-
307
-
308
-
309
-
310
-
311
-
312
-
313
-
314
-
315
-
316
-
317
-
318
-
319
-
320
-
321
-
322
-
323
-
324
-
325
-
326
-
327
-
328
-
329
-
330
-
331
-
332
-
333
-
334
-
335
-
336
-
337
-
338
-
339
-
340
-
341
-
342
-
343
-
344
-
345
-
346
-
347
-
348
-
349
-
350
-
351
-
352
-
353
-
354
-
355
-
356
-
357
-
358
-
359
-
360
-
361
-
362
-
363
-
364
-
365
-
366
-
367
-
368
-
369
-
370
-
371
-
372
-
373
-
374
-
375
-
376
-
377
-
378
-
379
-
380
-
381
-
382
-
383
-
384
-
385
-
386
-
387
-
388
-
389
-
390
 |
 |

RBS Group Annual Report and Accounts 200992
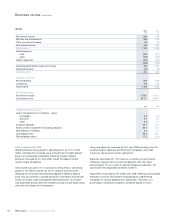
2009 compared with 2008
Wealth produced strong growth in operating profit, up 21% to £420
million, reflecting the increased value of the division’s healthy deposit
base in an increasingly competitive market for funding. Deposit
balances increased by 5% from 2008, though the deposit market
remains highly competitive.
Total income was up 5% (1% in constant currency terms), with strong
growth in net interest income, up 12% in constant currency terms
reflecting the increased internal pricing applied to Wealth’s deposit
base. This was offset by a marked decrease in investment income year
on year as assets under management decreased by 8% at constant
exchange rates during 2009, with investors turning to more liquid assets
and away from longer term investments.
Loans and advances increased by 10% over 2008, primarily in the UK.
Lending margins improved, particularly for mortgages, and credit
metrics for new business remain satisfactory.
Expenses were down 6% (10% lower on a constant currency basis),
reflecting a rigorous focus on cost management, with staff costs
decreasing by 11% as a result of planned headcount reduction. The
cost:income ratio improved from 65.6% to 59.2%.
Impairments increased by £17 million over 2008 reflecting some isolated
difficulties in the UK and offshore mortgage books (representing
mortgages for second properties for expatriates). Provisions as a
percentage of lending to customers increased slightly to 0.25%.
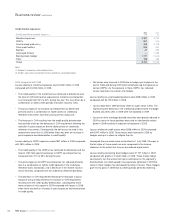
Wealth 2009 2008
£m £m
Net interest income 663 578
Net fees and commissions 363 405
Other non-interest income 83 76
Non-interest income 446 481
Total income 1,109 1,059
Direct expenses
– staff (357) (377)
– other (139) (156)
Indirect expenses (160) (162)
(656) (695)
Operating profit before impairment losses 453 364
Impairment losses (33) (16)
Operating profit 420 348
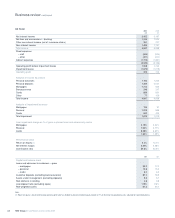
Analysis of income
Private Banking 916 819
Investments 193 240
Total income 1,109 1,059
Performance ratios
Net interest margin 4.38% 4.51%
Cost:income ratio 59.2% 65.6%
£bn £bn
Capital and balance sheet
Loans and advances to customers – gross
– mortgages 6.5 5.3
– personal 4.9 5.0
– other 2.3 2.1
Customer deposits 35.7 34.1
Assets under management (excluding deposits) 30.7 34.7
Risk elements in lending 0.2 0.1
Loan:deposit ratio 38% 36%
Risk-weighted assets 11.2 10.8
Business review continued