RBS 2009 Annual Report Download - page 144
Download and view the complete annual report
Please find page 144 of the 2009 RBS annual report below. You can navigate through the pages in the report by either clicking on the pages listed below, or by using the keyword search tool below to find specific information within the annual report.-
 1
1 -
2
-
3
-
4
-
5
-
6
-
7
-
8
-
9
-
10
-
11
-
12
-
13
-
14
-
15
-
16
-
17
-
18
-
19
-
20
-
21
-
22
-
23
-
24
-
25
-
26
-
27
-
28
-
29
-
30
-
31
-
32
-
33
-
34
-
35
-
36
-
37
-
38
-
39
-
40
-
41
-
42
-
43
-
44
-
45
-
46
-
47
-
48
-
49
-
50
-
51
-
52
-
53
-
54
-
55
-
56
-
57
-
58
-
59
-
60
-
61
-
62
-
63
-
64
-
65
-
66
-
67
-
68
-
69
-
70
-
71
-
72
-
73
-
74
-
75
-
76
-
77
-
78
-
79
-
80
-
81
-
82
-
83
-
84
-
85
-
86
-
87
-
88
-
89
-
90
-
91
-
92
-
93
-
94
-
95
-
96
-
97
-
98
-
99
-
100
-
101
-
102
-
103
-
104
-
105
-
106
-
107
-
108
-
109
-
110
-
111
-
112
-
113
-
114
-
115
-
116
-
117
-
118
-
119
-
120
-
121
-
122
-
123
-
124
-
125
-
126
-
127
-
128
-
129
-
130
-
131
-
132
-
133
-
 134
134 -
 135
135 -
 136
136 -
 137
137 -
 138
138 -
 139
139 -
 140
140 -
 141
141 -
 142
142 -
 143
143 -
 144
144 -
 145
145 -
 146
146 -
 147
147 -
 148
148 -
 149
149 -
 150
150 -
 151
151 -
 152
152 -
 153
153 -
 154
154 -
155
-
156
-
157
-
158
-
159
-
160
-
161
-
162
-
163
-
164
-
165
-
166
-
167
-
168
-
169
-
170
-
171
-
172
-
173
-
174
-
175
-
176
-
177
-
178
-
179
-
180
-
181
-
182
-
183
-
184
-
185
-
186
-
187
-
188
-
189
-
190
-
191
-
192
-
193
-
194
-
195
-
196
-
197
-
198
-
199
-
200
-
201
-
202
-
203
-
204
-
205
-
206
-
207
-
208
-
209
-
210
-
211
-
212
-
213
-
214
-
215
-
216
-
217
-
218
-
219
-
220
-
221
-
222
-
223
-
224
-
225
-
226
-
227
-
228
-
229
-
230
-
231
-
232
-
233
-
234
-
235
-
236
-
237
-
238
-
239
-
240
-
241
-
242
-
243
-
244
-
245
-
246
-
247
-
248
-
249
-
250
-
251
-
252
-
253
-
254
-
255
-
256
-
257
-
258
-
259
-
260
-
261
-
262
-
263
-
264
-
265
-
266
-
267
-
268
-
269
-
270
-
271
-
272
-
273
-
274
-
275
-
276
-
277
-
278
-
279
-
280
-
281
-
282
-
283
-
284
-
285
-
286
-
287
-
288
-
289
-
290
-
291
-
292
-
293
-
294
-
295
-
296
-
297
-
298
-
299
-
300
-
301
-
302
-
303
-
304
-
305
-
306
-
307
-
308
-
309
-
310
-
311
-
312
-
313
-
314
-
315
-
316
-
317
-
318
-
319
-
320
-
321
-
322
-
323
-
324
-
325
-
326
-
327
-
328
-
329
-
330
-
331
-
332
-
333
-
334
-
335
-
336
-
337
-
338
-
339
-
340
-
341
-
342
-
343
-
344
-
345
-
346
-
347
-
348
-
349
-
350
-
351
-
352
-
353
-
354
-
355
-
356
-
357
-
358
-
359
-
360
-
361
-
362
-
363
-
364
-
365
-
366
-
367
-
368
-
369
-
370
-
371
-
372
-
373
-
374
-
375
-
376
-
377
-
378
-
379
-
380
-
381
-
382
-
383
-
384
-
385
-
386
-
387
-
388
-
389
-
390
 |
 |

Business review continued
RBS Group Annual Report and Accounts 2009142
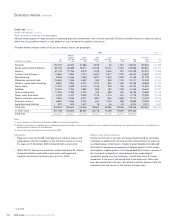
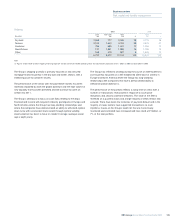
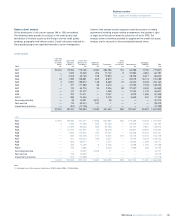
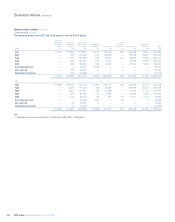
Risk elements in lending and potential problem loans by division Total
Total provision
REIL Total provision as as % of
REIL PPL & PPL provision % of REIL REIL & PPL
£m £m £m £m % %
2009
UK Retail 4,641 — 4,641 2,677 58 58
UK Corporate 2,330 97 2,427 1,271 55 52
Wealth 218 38 256 55 25 21
Global Banking & Markets 1,800 131 1,931 1,289 72 67
Global Transaction Services 197 4 201 189 96 94
Ulster Bank 2,260 2 2,262 962 43 43
US Retail & Commercial 643 — 643 478 74 74
Core 12,089 272 12,361 6,921 57 56
Non-Core 22,900 652 23,552 8,252 36 35
Group before RFS Holdings minority interest 34,989 924 35,913 15,173 43 42
RFS Holdings minority interest 3,260 85 3,345 2,110 65 63
38,249 1,009 39,258 17,283 45 44
2008
UK Retail 3,832 — 3,832 2,086 54 54
UK Corporate 1,254 74 1,328 696 56 52
Wealth 107 24 131 34 32 26
Global Banking & Markets 869 18 887 621 71 70
Global Transaction Services 53 — 53 43 81 81
Ulster Bank 1,196 1 1,197 491 41 41
US Retail & Commercial 424 — 424 298 70 70
Core 7,735 117 7,852 4,269 55 54
Non-Core 11,056 109 11,165 5,182 47 46
Group before RFS Holdings minority interest 18,791 226 19,017 9,451 50 50
RFS Holdings minority interest 2,470 — 2,470 1,565 63 63
21,261 226 21,487 11,016 52 51
2007
UK Retail 3,369 — 3,369 2,048 61 61
UK Corporate 1,187 16 1,203 737 62 61
Wealth 45 11 56 26 58 46
Global Banking & Markets 830 67 897 493 59 55
Global Transaction Services 73—73223030
Ulster Bank 442 1 443 314 71 71
US Retail & Commercial 229 — 229 220 96 96
Other ———30——
Core 6,175 95 6,270 3,890 63 62
Non-Core 2,076 36 2,112 1,082 52 51
Group before RFS Holdings minority interest 8,251 131 8,382 4,972 60 59
RFS Holdings minority interest 2,480 540 3,020 1,480 60 49
10,731 671 11,402 6,452 60 57
Key points
•Provision coverage fell during the year from 52% to 45% (REIL & PPL
coverage fell from 51% to 44%) as a consequence of the growth in
REIL being concentrated in secured, property-related loans. These
loans require relatively lower provisions in view of their collateralised
nature. With many of these being in Non-Core, the provision coverage
ratio is lower in Non-Core than in Core.
•Provision coverage in Core business improved from 55% to 57%.
•REIL in the Core businesses increased by £4.4 billion to £12.1 billion
while REIL in Non-Core more than doubled to £22.9 billion.
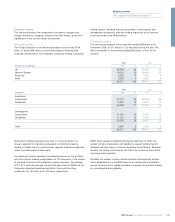
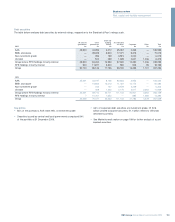
Credit risk continued
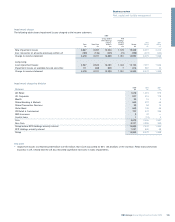
Risk elements and impairments
All the disclosures in this section (pages 142 to 148) are audited. The
Group classifies impaired assets as either risk elements in lending
(REIL) or potential problem loans (PPL). REIL represents non-accrual
loans, loans that are accruing but are past due 90 days and
restructured loans. PPL represents impaired assets which are not
included in REIL, but where information about possible credit problems
cause management to have serious doubts about the future ability of
the borrower to comply with loan repayment terms.
Both REIL and PPL are reported gross and take no account of the value
of any security held which could reduce the eventual loss should it
occur, nor of any provision marked. Therefore impaired assets which are
highly collateralised, such as mortgages, will have a low coverage ratio
of provisions held against the reported impaired balance.
The analyses of risk elements in lending and impairments as discussed
below, form a key part of the data provided to senior management on
the credit performance of the Group’s portfolios.