RBS 2009 Annual Report Download - page 184
Download and view the complete annual report
Please find page 184 of the 2009 RBS annual report below. You can navigate through the pages in the report by either clicking on the pages listed below, or by using the keyword search tool below to find specific information within the annual report.-
 1
1 -
2
-
3
-
4
-
5
-
6
-
7
-
8
-
9
-
10
-
11
-
12
-
13
-
14
-
15
-
16
-
17
-
18
-
19
-
20
-
21
-
22
-
23
-
24
-
25
-
26
-
27
-
28
-
29
-
30
-
31
-
32
-
33
-
34
-
35
-
36
-
37
-
38
-
39
-
40
-
41
-
42
-
43
-
44
-
45
-
46
-
47
-
48
-
49
-
50
-
51
-
52
-
53
-
54
-
55
-
56
-
57
-
58
-
59
-
60
-
61
-
62
-
63
-
64
-
65
-
66
-
67
-
68
-
69
-
70
-
71
-
72
-
73
-
74
-
75
-
76
-
77
-
78
-
79
-
80
-
81
-
82
-
83
-
84
-
85
-
86
-
87
-
88
-
89
-
90
-
91
-
92
-
93
-
94
-
95
-
96
-
97
-
98
-
99
-
100
-
101
-
102
-
103
-
104
-
105
-
106
-
107
-
108
-
109
-
110
-
111
-
112
-
113
-
114
-
115
-
116
-
117
-
118
-
119
-
120
-
121
-
122
-
123
-
124
-
125
-
126
-
127
-
128
-
129
-
130
-
131
-
132
-
133
-
134
-
135
-
136
-
137
-
138
-
139
-
140
-
141
-
142
-
143
-
144
-
145
-
146
-
147
-
148
-
149
-
150
-
151
-
152
-
153
-
154
-
155
-
156
-
157
-
158
-
159
-
160
-
161
-
162
-
163
-
164
-
165
-
166
-
167
-
168
-
169
-
170
-
171
-
172
-
173
-
 174
174 -
 175
175 -
 176
176 -
 177
177 -
 178
178 -
 179
179 -
 180
180 -
 181
181 -
 182
182 -
 183
183 -
 184
184 -
 185
185 -
 186
186 -
 187
187 -
 188
188 -
 189
189 -
 190
190 -
 191
191 -
 192
192 -
 193
193 -
 194
194 -
195
-
196
-
197
-
198
-
199
-
200
-
201
-
202
-
203
-
204
-
205
-
206
-
207
-
208
-
209
-
210
-
211
-
212
-
213
-
214
-
215
-
216
-
217
-
218
-
219
-
220
-
221
-
222
-
223
-
224
-
225
-
226
-
227
-
228
-
229
-
230
-
231
-
232
-
233
-
234
-
235
-
236
-
237
-
238
-
239
-
240
-
241
-
242
-
243
-
244
-
245
-
246
-
247
-
248
-
249
-
250
-
251
-
252
-
253
-
254
-
255
-
256
-
257
-
258
-
259
-
260
-
261
-
262
-
263
-
264
-
265
-
266
-
267
-
268
-
269
-
270
-
271
-
272
-
273
-
274
-
275
-
276
-
277
-
278
-
279
-
280
-
281
-
282
-
283
-
284
-
285
-
286
-
287
-
288
-
289
-
290
-
291
-
292
-
293
-
294
-
295
-
296
-
297
-
298
-
299
-
300
-
301
-
302
-
303
-
304
-
305
-
306
-
307
-
308
-
309
-
310
-
311
-
312
-
313
-
314
-
315
-
316
-
317
-
318
-
319
-
320
-
321
-
322
-
323
-
324
-
325
-
326
-
327
-
328
-
329
-
330
-
331
-
332
-
333
-
334
-
335
-
336
-
337
-
338
-
339
-
340
-
341
-
342
-
343
-
344
-
345
-
346
-
347
-
348
-
349
-
350
-
351
-
352
-
353
-
354
-
355
-
356
-
357
-
358
-
359
-
360
-
361
-
362
-
363
-
364
-
365
-
366
-
367
-
368
-
369
-
370
-
371
-
372
-
373
-
374
-
375
-
376
-
377
-
378
-
379
-
380
-
381
-
382
-
383
-
384
-
385
-
386
-
387
-
388
-
389
-
390
 |
 |

Business review continued
RBS Group Annual Report and Accounts 2009182
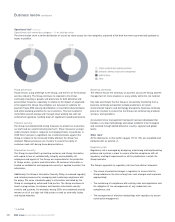
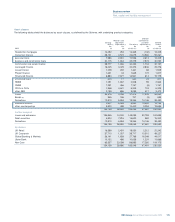
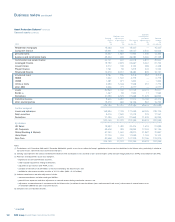
Asset Protection Scheme* continued
Covered assets continued
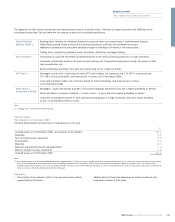
Geographical breakdown
The table below provides a geographical breakdown of covered assets, based on the country of domicile or incorporation of the obligor, and by HMT
asset class.
Residential Consumer Commercial Leveraged Lease Project Structured Covered
mortgages finance real estate finance finance finance finance Loan Bonds Derivative amount
£m £m £m £m £m £m £m £m £m £m £m
2009
UK 10,102 46,027 15,285 8,406 997 167 2,433 15,879 53 8,379 107,728
Western Europe 3,971 6,814 12,080 9,448 485 904 2,963 21,273 105 2,369 60,412
North America 118 46 1,702 4,039 2 228 3,406 8,019 25 17,325 34,910
Latin America 1 282 2,042 476 17 40 5,628 2,593 7 4,068 15,154
Other 13 92 1,028 907 28 478 745 7,178 508 1,349 12,326
14,205 53,261 32,137 23,276 1,529 1,817 15,175 54,942 698 33,490 230,530
2008
UK 10,799 46,459 20,127 9,617 1,537 264 2,778 21,050 115 10,074 122,820
Western Europe 4,468 7,654 13,848 11,685 845 1,004 4,226 31,461 370 3,231 78,792
North America 139 46 2,381 4,880 4 261 4,187 12,493 499 19,567 44,457
Latin America 1 287 2,201 601 19 45 6,550 4,365 18 4,486 18,573
Other 20 97 1,293 951 33 669 1,450 10,608 561 1,635 17,317
15,427 54,543 39,850 27,734 2,438 2,243 19,191 79,977 1,563 38,993 281,959
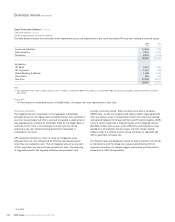
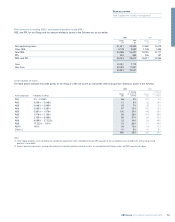
Currency breakdown
The table below shows the currency breakdown of covered assets.
2009 2008
£m £m
GBP 107,731 121,440
Euro 56,586 72,989
USD 58,489 77,298
AUD 3,276 3,981
JPY 1,725 2,157
Other 2,723 4,094
230,530 281,959
The analysis by currency does not reflect hedges that the Group may have in place.
* unaudited