RBS 2009 Annual Report Download - page 231
Download and view the complete annual report
Please find page 231 of the 2009 RBS annual report below. You can navigate through the pages in the report by either clicking on the pages listed below, or by using the keyword search tool below to find specific information within the annual report.-
 1
1 -
2
-
3
-
4
-
5
-
6
-
7
-
8
-
9
-
10
-
11
-
12
-
13
-
14
-
15
-
16
-
17
-
18
-
19
-
20
-
21
-
22
-
23
-
24
-
25
-
26
-
27
-
28
-
29
-
30
-
31
-
32
-
33
-
34
-
35
-
36
-
37
-
38
-
39
-
40
-
41
-
42
-
43
-
44
-
45
-
46
-
47
-
48
-
49
-
50
-
51
-
52
-
53
-
54
-
55
-
56
-
57
-
58
-
59
-
60
-
61
-
62
-
63
-
64
-
65
-
66
-
67
-
68
-
69
-
70
-
71
-
72
-
73
-
74
-
75
-
76
-
77
-
78
-
79
-
80
-
81
-
82
-
83
-
84
-
85
-
86
-
87
-
88
-
89
-
90
-
91
-
92
-
93
-
94
-
95
-
96
-
97
-
98
-
99
-
100
-
101
-
102
-
103
-
104
-
105
-
106
-
107
-
108
-
109
-
110
-
111
-
112
-
113
-
114
-
115
-
116
-
117
-
118
-
119
-
120
-
121
-
122
-
123
-
124
-
125
-
126
-
127
-
128
-
129
-
130
-
131
-
132
-
133
-
134
-
135
-
136
-
137
-
138
-
139
-
140
-
141
-
142
-
143
-
144
-
145
-
146
-
147
-
148
-
149
-
150
-
151
-
152
-
153
-
154
-
155
-
156
-
157
-
158
-
159
-
160
-
161
-
162
-
163
-
164
-
165
-
166
-
167
-
168
-
169
-
170
-
171
-
172
-
173
-
174
-
175
-
176
-
177
-
178
-
179
-
180
-
181
-
182
-
183
-
184
-
185
-
186
-
187
-
188
-
189
-
190
-
191
-
192
-
193
-
194
-
195
-
196
-
197
-
198
-
199
-
200
-
201
-
202
-
203
-
204
-
205
-
206
-
207
-
208
-
209
-
210
-
211
-
212
-
213
-
214
-
215
-
216
-
217
-
218
-
219
-
220
-
 221
221 -
 222
222 -
 223
223 -
 224
224 -
 225
225 -
 226
226 -
 227
227 -
 228
228 -
 229
229 -
 230
230 -
 231
231 -
 232
232 -
 233
233 -
 234
234 -
 235
235 -
 236
236 -
 237
237 -
 238
238 -
 239
239 -
 240
240 -
 241
241 -
242
-
243
-
244
-
245
-
246
-
247
-
248
-
249
-
250
-
251
-
252
-
253
-
254
-
255
-
256
-
257
-
258
-
259
-
260
-
261
-
262
-
263
-
264
-
265
-
266
-
267
-
268
-
269
-
270
-
271
-
272
-
273
-
274
-
275
-
276
-
277
-
278
-
279
-
280
-
281
-
282
-
283
-
284
-
285
-
286
-
287
-
288
-
289
-
290
-
291
-
292
-
293
-
294
-
295
-
296
-
297
-
298
-
299
-
300
-
301
-
302
-
303
-
304
-
305
-
306
-
307
-
308
-
309
-
310
-
311
-
312
-
313
-
314
-
315
-
316
-
317
-
318
-
319
-
320
-
321
-
322
-
323
-
324
-
325
-
326
-
327
-
328
-
329
-
330
-
331
-
332
-
333
-
334
-
335
-
336
-
337
-
338
-
339
-
340
-
341
-
342
-
343
-
344
-
345
-
346
-
347
-
348
-
349
-
350
-
351
-
352
-
353
-
354
-
355
-
356
-
357
-
358
-
359
-
360
-
361
-
362
-
363
-
364
-
365
-
366
-
367
-
368
-
369
-
370
-
371
-
372
-
373
-
374
-
375
-
376
-
377
-
378
-
379
-
380
-
381
-
382
-
383
-
384
-
385
-
386
-
387
-
388
-
389
-
390
 |
 |
229RBS Group Annual Report and Accounts 2009
Governance
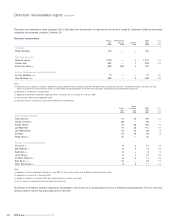
Group Chief Executive – Stephen Hester
Stephen Hester received certain share awards on appointment as
Group Chief Executive and share awards to replace bonus and share
awards he forfeited on leaving The British Land Company PLC. He was
granted conditional share awards over a total of 10,407,081 shares.
Subject to their terms, the majority of these awards vest between
February 2009 and the third anniversary of his appointment as Group
Chief Executive.
In 2009, Stephen Hester received an award over 4,800,000 shares
under the MPP and options over 9,550,000 shares under the ESOP. The
performance conditions attached to the vesting of these awards are
based on absolute and relative Total Shareholder Return metrics as
described on page 235. Before the Remuneration Committee will permit
any of Stephen Hester’s shares to vest, it will consider underlying
financial performance of the Group and whether this performance is
delivered in a way which is consistent with effective risk management.
Stephen Hester has voluntarily agreed to retain any shares that he
receives under the MPP in 2009 for a further two years past the vesting
date. This reflects his personal commitment to driving the Group’s
performance over the longer term.
Group Finance Director – Bruce Van Saun
On joining the Group, Bruce Van Saun was made a conditional share
award of 1,810,611 shares under the MPP and options over 905,306
shares under the ESOP. Both awards will vest on 8 September 2012, the
third anniversary of him joining the Group, and are subject to
performance conditions.
The ESOP and MPP awards made to Bruce Van Saun are subject to the
same absolute and relative TSR targets that apply to Stephen Hester’s
awards, including the performance underpin allowing the Remuneration
Committee to adjust awards if the vesting outcome does not reflect the
Group’s underlying performance and management of risk.
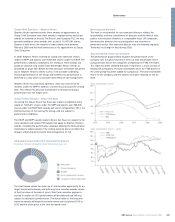
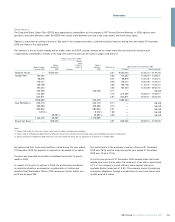
UK-based executive directors’ remuneration balance
Executive director (including Chief Executive) pay mix
The chart above shows the make up of remuneration opportunity for on-
target annual performance, and with long term incentive awards shown
at their fair value at the date of grant. Short term incentive payments
earned in relation to 2010 performance will be deferred and will vest,
subject to satisfactory performance. The actual value of the long term
incentive awards will depend on performance over the period 2010 to
2012 and the share price at the time the awards vest.
Non-executive directors
The level of remuneration for non-executive directors reflects the
responsibility and time commitment of directors and the level of fees
paid to non-executive directors of comparable major UK companies.
Non-executive directors do not participate in any incentive or
performance plan. Non-executive director fees are reviewed regularly.
There was no change in fees during 2009.
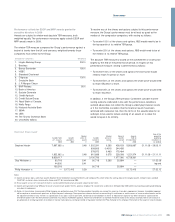
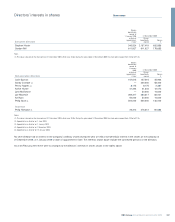
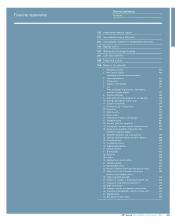
Total shareholder return performance
The performance graphs below illustrate the performance of the
company over the past five years in terms of total shareholder return
compared with that of the companies comprising the FTSE 100 Index.
This Index has been selected because it represents a cross-section of
leading UK companies. The total shareholder return for FTSE banks for
the same period has been added for comparison. The total shareholder
return for the company and the indices have been rebased to 100 for
2004.
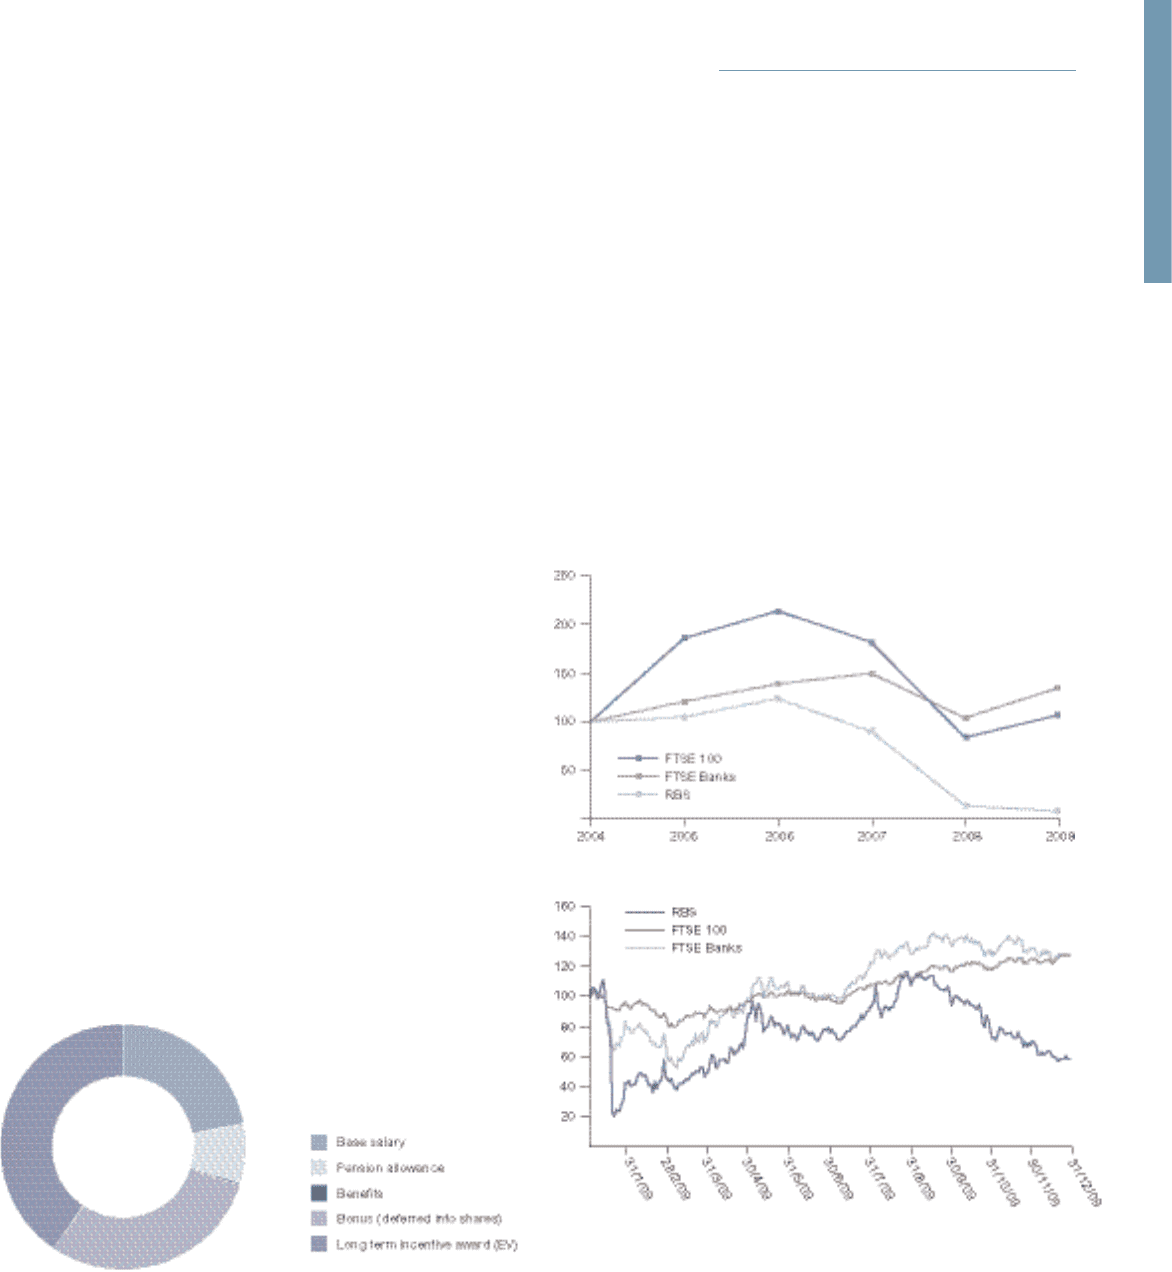
Total shareholder return
Total shareholder return – daily