RBS 2009 Annual Report Download - page 202
Download and view the complete annual report
Please find page 202 of the 2009 RBS annual report below. You can navigate through the pages in the report by either clicking on the pages listed below, or by using the keyword search tool below to find specific information within the annual report.-
 1
1 -
2
-
3
-
4
-
5
-
6
-
7
-
8
-
9
-
10
-
11
-
12
-
13
-
14
-
15
-
16
-
17
-
18
-
19
-
20
-
21
-
22
-
23
-
24
-
25
-
26
-
27
-
28
-
29
-
30
-
31
-
32
-
33
-
34
-
35
-
36
-
37
-
38
-
39
-
40
-
41
-
42
-
43
-
44
-
45
-
46
-
47
-
48
-
49
-
50
-
51
-
52
-
53
-
54
-
55
-
56
-
57
-
58
-
59
-
60
-
61
-
62
-
63
-
64
-
65
-
66
-
67
-
68
-
69
-
70
-
71
-
72
-
73
-
74
-
75
-
76
-
77
-
78
-
79
-
80
-
81
-
82
-
83
-
84
-
85
-
86
-
87
-
88
-
89
-
90
-
91
-
92
-
93
-
94
-
95
-
96
-
97
-
98
-
99
-
100
-
101
-
102
-
103
-
104
-
105
-
106
-
107
-
108
-
109
-
110
-
111
-
112
-
113
-
114
-
115
-
116
-
117
-
118
-
119
-
120
-
121
-
122
-
123
-
124
-
125
-
126
-
127
-
128
-
129
-
130
-
131
-
132
-
133
-
134
-
135
-
136
-
137
-
138
-
139
-
140
-
141
-
142
-
143
-
144
-
145
-
146
-
147
-
148
-
149
-
150
-
151
-
152
-
153
-
154
-
155
-
156
-
157
-
158
-
159
-
160
-
161
-
162
-
163
-
164
-
165
-
166
-
167
-
168
-
169
-
170
-
171
-
172
-
173
-
174
-
175
-
176
-
177
-
178
-
179
-
180
-
181
-
182
-
183
-
184
-
185
-
186
-
187
-
188
-
189
-
190
-
191
-
 192
192 -
 193
193 -
 194
194 -
 195
195 -
 196
196 -
 197
197 -
 198
198 -
 199
199 -
 200
200 -
 201
201 -
 202
202 -
 203
203 -
 204
204 -
 205
205 -
 206
206 -
 207
207 -
 208
208 -
 209
209 -
 210
210 -
 211
211 -
 212
212 -
213
-
214
-
215
-
216
-
217
-
218
-
219
-
220
-
221
-
222
-
223
-
224
-
225
-
226
-
227
-
228
-
229
-
230
-
231
-
232
-
233
-
234
-
235
-
236
-
237
-
238
-
239
-
240
-
241
-
242
-
243
-
244
-
245
-
246
-
247
-
248
-
249
-
250
-
251
-
252
-
253
-
254
-
255
-
256
-
257
-
258
-
259
-
260
-
261
-
262
-
263
-
264
-
265
-
266
-
267
-
268
-
269
-
270
-
271
-
272
-
273
-
274
-
275
-
276
-
277
-
278
-
279
-
280
-
281
-
282
-
283
-
284
-
285
-
286
-
287
-
288
-
289
-
290
-
291
-
292
-
293
-
294
-
295
-
296
-
297
-
298
-
299
-
300
-
301
-
302
-
303
-
304
-
305
-
306
-
307
-
308
-
309
-
310
-
311
-
312
-
313
-
314
-
315
-
316
-
317
-
318
-
319
-
320
-
321
-
322
-
323
-
324
-
325
-
326
-
327
-
328
-
329
-
330
-
331
-
332
-
333
-
334
-
335
-
336
-
337
-
338
-
339
-
340
-
341
-
342
-
343
-
344
-
345
-
346
-
347
-
348
-
349
-
350
-
351
-
352
-
353
-
354
-
355
-
356
-
357
-
358
-
359
-
360
-
361
-
362
-
363
-
364
-
365
-
366
-
367
-
368
-
369
-
370
-
371
-
372
-
373
-
374
-
375
-
376
-
377
-
378
-
379
-
380
-
381
-
382
-
383
-
384
-
385
-
386
-
387
-
388
-
389
-
390
 |
 |
Business review continued
RBS Group Annual Report and Accounts 2009200
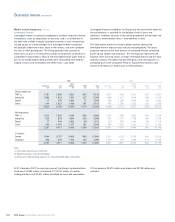
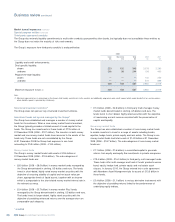
Market turmoil exposures continued
Leveraged finance
Leveraged finance is commonly employed to facilitate corporate finance
transactions, such as acquisitions or buy-outs, and is so called due to
the high ratio of debt to equity (leverage) common in such transactions.
A bank acting as a lead manager for a leveraged finance transaction
will typically underwrite a loan, alone or with others, and then syndicate
the loan to other participants. The Group typically held a portion of
these loans as part of its long-term portfolio once primary syndication is
completed (‘hold portfolio’). Most of the leveraged finance loans held as
part of the syndicated lending portfolio were reclassified from held-for-
trading to loans and receivables with effect from 1 July 2008.
Leveraged finance provided by the Group that has been drawn down by
the counterparty is reported on the balance sheet in loans and
advances. Undrawn amounts of the facility provided to the borrower are
reported in memorandum items – commitments to lend.
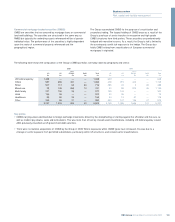
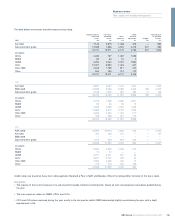
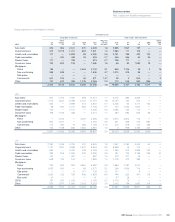
The table below shows the Group’s global markets sponsor-led
leveraged finance exposures by industry and geography. The gross
exposure represents the total amount of leveraged finance committed
by the Group (drawn and undrawn). The net exposure represents the
balance sheet carrying values of drawn leveraged finance and the total
undrawn amount. The difference between gross and net exposures is
principally due to the cumulative effect of impairment provisions and
historic write-downs on assets prior to reclassification.
2009 2008
Other Other
Americas UK Europe RoW Total Americas UK Europe RoW Total
£m £m £m £m £m £m £m £m £m £m
Gross exposure:
TMT (2) 1,781 1,656 1,081 605 5,123 2,507 1,484 2,001 535 6,527
Industrial 1,584 1,523 1,781 207 5,095 1,686 1,612 1,924 188 5,410
Retail 17 476 1,354 71 1,918 268 1,285 1,440 89 3,082
Other 244 1,527 1,168 191 3,130 487 1,391 1,282 126 3,286
3,626 5,182 5,384 1,074 15,266 4,948 5,772 6,647 938 18,305
Net exposure:
TMT (2) 1,502 1,532 1,045 590 4,669 2,247 1,385 1,982 534 6,148
Industrial 524 973 1,594 205 3,296 607 1,157 1,758 186 3,708
Retail 17 445 1,282 68 1,812 223 978 1,424 89 2,714
Other 244 1,461 1,147 191 3,043 484 1,307 1,281 127 3,199
2,287 4,411 5,068 1,054 12,820 3,561 4,827 6,445 936 15,769
Of which:
Drawn 1,944 3,737 3,909 950 10,540 2,511 4,125 5,159 824 12,619
Undrawn 343 674 1,159 104 2,280 1,050 702 1,286 112 3,150
2,287 4,411 5,068 1,054 12,820 3,561 4,827 6,445 936 15,769
Notes:
(1) All the above exposures are in Non-Core.
(2) Telecommunications, media and technology.
(3) There were no held-for-trading exposures at 31 December 2009 (2008 – £102 million).
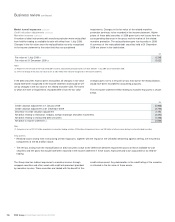
At 31 December 2007 the carrying value of the Group’s syndicated loan
book was £14,582 million, comprised of £12,041 million of held-for-
trading positions and £2,541 million classified as loans and receivables.
Of this balance, £8,874 million was drawn and £5,708 million was
undrawn.