RBS 2009 Annual Report Download - page 287
Download and view the complete annual report
Please find page 287 of the 2009 RBS annual report below. You can navigate through the pages in the report by either clicking on the pages listed below, or by using the keyword search tool below to find specific information within the annual report.-
 1
1 -
2
-
3
-
4
-
5
-
6
-
7
-
8
-
9
-
10
-
11
-
12
-
13
-
14
-
15
-
16
-
17
-
18
-
19
-
20
-
21
-
22
-
23
-
24
-
25
-
26
-
27
-
28
-
29
-
30
-
31
-
32
-
33
-
34
-
35
-
36
-
37
-
38
-
39
-
40
-
41
-
42
-
43
-
44
-
45
-
46
-
47
-
48
-
49
-
50
-
51
-
52
-
53
-
54
-
55
-
56
-
57
-
58
-
59
-
60
-
61
-
62
-
63
-
64
-
65
-
66
-
67
-
68
-
69
-
70
-
71
-
72
-
73
-
74
-
75
-
76
-
77
-
78
-
79
-
80
-
81
-
82
-
83
-
84
-
85
-
86
-
87
-
88
-
89
-
90
-
91
-
92
-
93
-
94
-
95
-
96
-
97
-
98
-
99
-
100
-
101
-
102
-
103
-
104
-
105
-
106
-
107
-
108
-
109
-
110
-
111
-
112
-
113
-
114
-
115
-
116
-
117
-
118
-
119
-
120
-
121
-
122
-
123
-
124
-
125
-
126
-
127
-
128
-
129
-
130
-
131
-
132
-
133
-
134
-
135
-
136
-
137
-
138
-
139
-
140
-
141
-
142
-
143
-
144
-
145
-
146
-
147
-
148
-
149
-
150
-
151
-
152
-
153
-
154
-
155
-
156
-
157
-
158
-
159
-
160
-
161
-
162
-
163
-
164
-
165
-
166
-
167
-
168
-
169
-
170
-
171
-
172
-
173
-
174
-
175
-
176
-
177
-
178
-
179
-
180
-
181
-
182
-
183
-
184
-
185
-
186
-
187
-
188
-
189
-
190
-
191
-
192
-
193
-
194
-
195
-
196
-
197
-
198
-
199
-
200
-
201
-
202
-
203
-
204
-
205
-
206
-
207
-
208
-
209
-
210
-
211
-
212
-
213
-
214
-
215
-
216
-
217
-
218
-
219
-
220
-
221
-
222
-
223
-
224
-
225
-
226
-
227
-
228
-
229
-
230
-
231
-
232
-
233
-
234
-
235
-
236
-
237
-
238
-
239
-
240
-
241
-
242
-
243
-
244
-
245
-
246
-
247
-
248
-
249
-
250
-
251
-
252
-
253
-
254
-
255
-
256
-
257
-
258
-
259
-
260
-
261
-
262
-
263
-
264
-
265
-
266
-
267
-
268
-
269
-
270
-
271
-
272
-
273
-
274
-
275
-
276
-
 277
277 -
 278
278 -
 279
279 -
 280
280 -
 281
281 -
 282
282 -
 283
283 -
 284
284 -
 285
285 -
 286
286 -
 287
287 -
 288
288 -
 289
289 -
 290
290 -
 291
291 -
 292
292 -
 293
293 -
 294
294 -
 295
295 -
 296
296 -
 297
297 -
298
-
299
-
300
-
301
-
302
-
303
-
304
-
305
-
306
-
307
-
308
-
309
-
310
-
311
-
312
-
313
-
314
-
315
-
316
-
317
-
318
-
319
-
320
-
321
-
322
-
323
-
324
-
325
-
326
-
327
-
328
-
329
-
330
-
331
-
332
-
333
-
334
-
335
-
336
-
337
-
338
-
339
-
340
-
341
-
342
-
343
-
344
-
345
-
346
-
347
-
348
-
349
-
350
-
351
-
352
-
353
-
354
-
355
-
356
-
357
-
358
-
359
-
360
-
361
-
362
-
363
-
364
-
365
-
366
-
367
-
368
-
369
-
370
-
371
-
372
-
373
-
374
-
375
-
376
-
377
-
378
-
379
-
380
-
381
-
382
-
383
-
384
-
385
-
386
-
387
-
388
-
389
-
390
 |
 |

Financial statements
Notes on the accounts
285RBS Group Annual Report and Accounts 2009
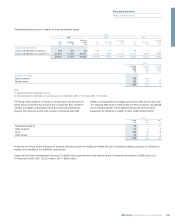
For each of the portfolio categories shown in the above table, set out
below is a description of the types of products that comprise the portfolio
and the valuation techniques that are applied in determining fair value,
including a description of valuation techniques used for levels 2 and 3
and inputs to those models and techniques. Where reasonably possible
alternative assumptions of unobservable inputs used in models would
change the fair value of the portfolio significantly, the alternative inputs
are indicated. Where there have been significant changes to valuation
techniques during the year a discussion of the reasons for this are also
included.
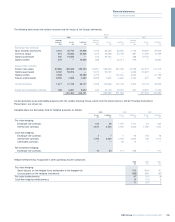
Loans and advances to customers
Loans in level 3 primarily comprise commercial mortgages.
Commercial mortgages
These senior and mezzanine commercial mortgages are loans secured
on commercial land and buildings that were originated or acquired by
the Group for securitisation. Senior commercial mortgages carry a
variable interest rate and mezzanine or more junior commercial
mortgages may carry a fixed or variable interest rate. Factors affecting
the value of these loans may include, but are not limited to, loan type,
underlying property type and geographic location, loan interest rate,
loan to value ratios, debt service coverage ratios, prepayment rates,
cumulative loan loss information, yields, investor demand, market
volatility since the last securitisation, and credit enhancement. Where
observable market prices for a particular loan are not available, the fair
value will typically be determined with reference to observable market
transactions in other loans or credit related products including debt
securities and credit derivatives. Assumptions are made about the
relationship between the loan and the available benchmark data.
Debt securities
RMBS
RMBS where the underlying assets are US agency-backed mortgages
and there is regular trading are generally classified as level 2 in the fair
value hierarchy. RMBS are also classified as level 2 when regular trading
is not prevalent in the market, but similar executed trades or third-party
data including indices, broker quotes and pricing services can be used
to substantiate the fair value. RMBS are classified as level 3 when
trading activity is not available and a model with significant
unobservable data is utilised.
In determining whether an instrument is similar to that being valued, the
Group considers a range of factors, principally: the lending standards
of the brokers and underwriters that originated the mortgages, the lead
manager of the security, the issue date of the respective securities, the
underlying asset composition (including origination date, loan to value
ratios, historic loss information and geographic location of the
mortgages), the credit rating of the instrument, and any credit
protection that the instrument may benefit from, such as insurance
wraps or subordinated tranches. Where there are instances of market
observable data for several similar RMBS tranches, the Group considers
the extent of similar characteristics shared with the instrument being
valued, together with the frequency, tenor and nature of the trades that
have been observed. This method is most frequently used for US and
UK RMBS. RMBS of Dutch and Spanish originated mortgages
guaranteed by those governments are valued using the credit spreads
of the respective government debt and certain assumptions made by
the Group, or based on observable prices from Bloomberg or
consensus pricing services.
The Group primarily uses an industry standard model to project the
expected future cash flows to be received from the underlying
mortgages and to forecast how these cash flows will be distributed to
the various holders of the RMBS. This model utilises data provided by
the servicer of the underlying mortgage portfolio, layering on
assumptions for mortgage prepayments, probability of default,
expected losses, and yield. The Group uses data from third-party
sources to calibrate its assumptions, including pricing information from
third party pricing services, independent research, broker quotes, and
other independent sources. An assessment is made of third-party data
source to determine its applicability and reliability. The Group adjusts
the model price with a liquidity premium to reflect the price that the
instrument could be traded in the market and may also make
adjustments for model deficiencies.
The fair value of securities within each class of asset changes on a
broadly consistent basis in response to changes in given market factors.
However, the extent of the change, and therefore the range of
reasonably possible alternative assumptions, may be either more or less
pronounced, depending on the particular terms and circumstances of
the individual security. The Group believes that probability of default
was the least transparent input into Alt-A and prime RMBS modelled
valuations (and most sensitive to variations).
Commercial mortgage backed securities
CMBS is valued using an industry standard model and the inputs, where
possible, are corroborated using observable market data.
Collateralised debt obligations
CDOs purchased from third parties are valued using independent, third-
party quotes or independent lead manager indicative prices. For super
senior CDOs which have been originated by the Group no specific third-
party information is available. The valuation of these super senior CDOs
therefore takes into consideration outputs from a proprietary model,
market data and appropriate valuation adjustments.
A collateral net asset value methodology using dealer buy side marks to
determine an upper bound for super senior CDO valuations. An ABS
index implied collateral valuation, is also used which provides a market
calibrated valuation data point. Both the ABS index implied valuation
and the collateral net asset value methodology apply an assumed
immediate liquidation approach.
Collateralised loan obligations
To determine the fair value of CLOs purchased from third parties, the
Group use third-party broker or lead manager quotes as the primary
pricing source. These quotes are benchmarked to consensus pricing
sources where they are available.
For CLOs originated and still held by the Group, the fair value is
determined using a correlation model based on a Monte Carlo
simulation framework. The main model inputs are credit spreads and
recovery rates of the underlying assets and their correlation. A credit
curve is assigned to each underlying asset based on prices, from third-
party dealer quotes, and cash flow profiles, sourced from an industry
standard model. Losses are calculated taking into account the
attachment and detachment point of the exposure. Where the
correlation inputs to this model are not observable CLOs are deemed to
be level 3.