RBS 2009 Annual Report Download - page 164
Download and view the complete annual report
Please find page 164 of the 2009 RBS annual report below. You can navigate through the pages in the report by either clicking on the pages listed below, or by using the keyword search tool below to find specific information within the annual report.-
 1
1 -
2
-
3
-
4
-
5
-
6
-
7
-
8
-
9
-
10
-
11
-
12
-
13
-
14
-
15
-
16
-
17
-
18
-
19
-
20
-
21
-
22
-
23
-
24
-
25
-
26
-
27
-
28
-
29
-
30
-
31
-
32
-
33
-
34
-
35
-
36
-
37
-
38
-
39
-
40
-
41
-
42
-
43
-
44
-
45
-
46
-
47
-
48
-
49
-
50
-
51
-
52
-
53
-
54
-
55
-
56
-
57
-
58
-
59
-
60
-
61
-
62
-
63
-
64
-
65
-
66
-
67
-
68
-
69
-
70
-
71
-
72
-
73
-
74
-
75
-
76
-
77
-
78
-
79
-
80
-
81
-
82
-
83
-
84
-
85
-
86
-
87
-
88
-
89
-
90
-
91
-
92
-
93
-
94
-
95
-
96
-
97
-
98
-
99
-
100
-
101
-
102
-
103
-
104
-
105
-
106
-
107
-
108
-
109
-
110
-
111
-
112
-
113
-
114
-
115
-
116
-
117
-
118
-
119
-
120
-
121
-
122
-
123
-
124
-
125
-
126
-
127
-
128
-
129
-
130
-
131
-
132
-
133
-
134
-
135
-
136
-
137
-
138
-
139
-
140
-
141
-
142
-
143
-
144
-
145
-
146
-
147
-
148
-
149
-
150
-
151
-
152
-
153
-
 154
154 -
 155
155 -
 156
156 -
 157
157 -
 158
158 -
 159
159 -
 160
160 -
 161
161 -
 162
162 -
 163
163 -
 164
164 -
 165
165 -
 166
166 -
 167
167 -
 168
168 -
 169
169 -
 170
170 -
 171
171 -
 172
172 -
 173
173 -
 174
174 -
175
-
176
-
177
-
178
-
179
-
180
-
181
-
182
-
183
-
184
-
185
-
186
-
187
-
188
-
189
-
190
-
191
-
192
-
193
-
194
-
195
-
196
-
197
-
198
-
199
-
200
-
201
-
202
-
203
-
204
-
205
-
206
-
207
-
208
-
209
-
210
-
211
-
212
-
213
-
214
-
215
-
216
-
217
-
218
-
219
-
220
-
221
-
222
-
223
-
224
-
225
-
226
-
227
-
228
-
229
-
230
-
231
-
232
-
233
-
234
-
235
-
236
-
237
-
238
-
239
-
240
-
241
-
242
-
243
-
244
-
245
-
246
-
247
-
248
-
249
-
250
-
251
-
252
-
253
-
254
-
255
-
256
-
257
-
258
-
259
-
260
-
261
-
262
-
263
-
264
-
265
-
266
-
267
-
268
-
269
-
270
-
271
-
272
-
273
-
274
-
275
-
276
-
277
-
278
-
279
-
280
-
281
-
282
-
283
-
284
-
285
-
286
-
287
-
288
-
289
-
290
-
291
-
292
-
293
-
294
-
295
-
296
-
297
-
298
-
299
-
300
-
301
-
302
-
303
-
304
-
305
-
306
-
307
-
308
-
309
-
310
-
311
-
312
-
313
-
314
-
315
-
316
-
317
-
318
-
319
-
320
-
321
-
322
-
323
-
324
-
325
-
326
-
327
-
328
-
329
-
330
-
331
-
332
-
333
-
334
-
335
-
336
-
337
-
338
-
339
-
340
-
341
-
342
-
343
-
344
-
345
-
346
-
347
-
348
-
349
-
350
-
351
-
352
-
353
-
354
-
355
-
356
-
357
-
358
-
359
-
360
-
361
-
362
-
363
-
364
-
365
-
366
-
367
-
368
-
369
-
370
-
371
-
372
-
373
-
374
-
375
-
376
-
377
-
378
-
379
-
380
-
381
-
382
-
383
-
384
-
385
-
386
-
387
-
388
-
389
-
390
 |
 |

Business review continued
RBS Group Annual Report and Accounts 2009162
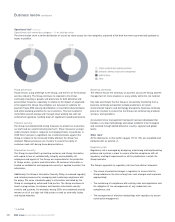
Market risk continued
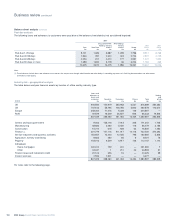
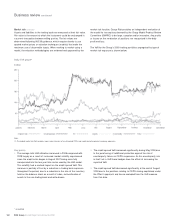
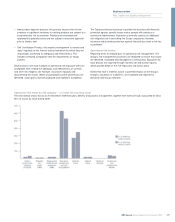
Assets and liabilities in the trading book are measured at their fair value.
Fair value is the amount at which the instrument could be exchanged in
a current transaction between willing parties. The fair values are
determined following IAS 39 guidance, which requires banks to use
quoted market prices or valuation techniques (models) that make the
maximum use of observable inputs. When marking to market using a
model, the valuation methodologies are reviewed and approved by the
market risk function. Group Risk provides an independent evaluation of
the model for transactions deemed by the Group Model Product Review
Committee (GMPRC) to be large, complex and/or innovative. Any profits
or losses on the revaluation of positions are recognised in the daily
profit and loss.
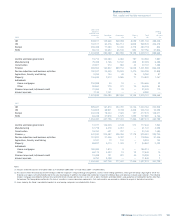
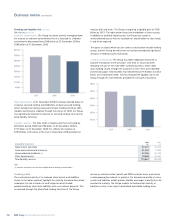
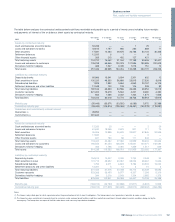
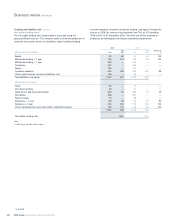
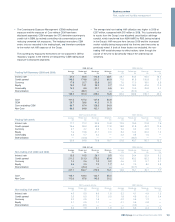
The VaR for the Group’s 2009 trading portfolios segregated by type of
market risk exposure is shown below.
Daily VaR graph*
Key points
•The average total VaR utilisation increased in 2009 compared with
2008 largely as a result of increased market volatility experienced
since the credit crisis began in August 2007 being more fully
incorporated into the two year time series used by the VaR model.
This volatility had a marked impact on the credit spread VaR. This
increase is partially off-set by a reduction in trading book exposure
throughout the period, due to a reduction in the size of the inventory
held on the balance sheet as a result of sales, reclassification of
assets to the non-trading book and write-downs.
•The credit spread VaR increased significantly during May 2009 due
to the purchasing of additional protection against the risk of
counterparty failure on CDPCs exposures. As this counterparty risk
is itself not in VaR these hedges have the effect of increasing the
reported VaR.
•The credit spread VaR decreased significantly at the end of August
2009 due to the positions relating to CDPCs being capitalised under
the Pillar II approach and hence excluded from the VaR measure
from that date.
* unaudited
Note:
(1) The traded market risk VaR excludes super senior tranches of asset backed CDOs and credit derivative product company exposures.