RBS 2009 Annual Report Download - page 290
Download and view the complete annual report
Please find page 290 of the 2009 RBS annual report below. You can navigate through the pages in the report by either clicking on the pages listed below, or by using the keyword search tool below to find specific information within the annual report.-
 1
1 -
2
-
3
-
4
-
5
-
6
-
7
-
8
-
9
-
10
-
11
-
12
-
13
-
14
-
15
-
16
-
17
-
18
-
19
-
20
-
21
-
22
-
23
-
24
-
25
-
26
-
27
-
28
-
29
-
30
-
31
-
32
-
33
-
34
-
35
-
36
-
37
-
38
-
39
-
40
-
41
-
42
-
43
-
44
-
45
-
46
-
47
-
48
-
49
-
50
-
51
-
52
-
53
-
54
-
55
-
56
-
57
-
58
-
59
-
60
-
61
-
62
-
63
-
64
-
65
-
66
-
67
-
68
-
69
-
70
-
71
-
72
-
73
-
74
-
75
-
76
-
77
-
78
-
79
-
80
-
81
-
82
-
83
-
84
-
85
-
86
-
87
-
88
-
89
-
90
-
91
-
92
-
93
-
94
-
95
-
96
-
97
-
98
-
99
-
100
-
101
-
102
-
103
-
104
-
105
-
106
-
107
-
108
-
109
-
110
-
111
-
112
-
113
-
114
-
115
-
116
-
117
-
118
-
119
-
120
-
121
-
122
-
123
-
124
-
125
-
126
-
127
-
128
-
129
-
130
-
131
-
132
-
133
-
134
-
135
-
136
-
137
-
138
-
139
-
140
-
141
-
142
-
143
-
144
-
145
-
146
-
147
-
148
-
149
-
150
-
151
-
152
-
153
-
154
-
155
-
156
-
157
-
158
-
159
-
160
-
161
-
162
-
163
-
164
-
165
-
166
-
167
-
168
-
169
-
170
-
171
-
172
-
173
-
174
-
175
-
176
-
177
-
178
-
179
-
180
-
181
-
182
-
183
-
184
-
185
-
186
-
187
-
188
-
189
-
190
-
191
-
192
-
193
-
194
-
195
-
196
-
197
-
198
-
199
-
200
-
201
-
202
-
203
-
204
-
205
-
206
-
207
-
208
-
209
-
210
-
211
-
212
-
213
-
214
-
215
-
216
-
217
-
218
-
219
-
220
-
221
-
222
-
223
-
224
-
225
-
226
-
227
-
228
-
229
-
230
-
231
-
232
-
233
-
234
-
235
-
236
-
237
-
238
-
239
-
240
-
241
-
242
-
243
-
244
-
245
-
246
-
247
-
248
-
249
-
250
-
251
-
252
-
253
-
254
-
255
-
256
-
257
-
258
-
259
-
260
-
261
-
262
-
263
-
264
-
265
-
266
-
267
-
268
-
269
-
270
-
271
-
272
-
273
-
274
-
275
-
276
-
277
-
278
-
279
-
 280
280 -
 281
281 -
 282
282 -
 283
283 -
 284
284 -
 285
285 -
 286
286 -
 287
287 -
 288
288 -
 289
289 -
 290
290 -
 291
291 -
 292
292 -
 293
293 -
 294
294 -
 295
295 -
 296
296 -
 297
297 -
 298
298 -
 299
299 -
 300
300 -
301
-
302
-
303
-
304
-
305
-
306
-
307
-
308
-
309
-
310
-
311
-
312
-
313
-
314
-
315
-
316
-
317
-
318
-
319
-
320
-
321
-
322
-
323
-
324
-
325
-
326
-
327
-
328
-
329
-
330
-
331
-
332
-
333
-
334
-
335
-
336
-
337
-
338
-
339
-
340
-
341
-
342
-
343
-
344
-
345
-
346
-
347
-
348
-
349
-
350
-
351
-
352
-
353
-
354
-
355
-
356
-
357
-
358
-
359
-
360
-
361
-
362
-
363
-
364
-
365
-
366
-
367
-
368
-
369
-
370
-
371
-
372
-
373
-
374
-
375
-
376
-
377
-
378
-
379
-
380
-
381
-
382
-
383
-
384
-
385
-
386
-
387
-
388
-
389
-
390
 |
 |

Notes on the accounts continued
RBS Group Annual Report and Accounts 2009288
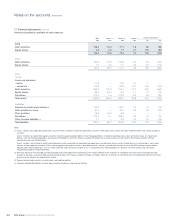
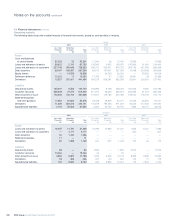
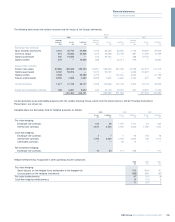
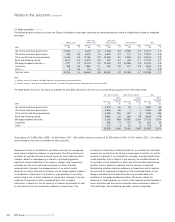
11 Financial instruments continued
Level 3 portfolio movement table Gains or Gains or
losses losses
recognised relating to
At in the income Transfers At 31 instruments
1 January statement or in/out of Reclass- Purchases Sales and Foreign December held at
2009 SOCI (1) Level 3 ification and issues settlements exchange 2009 year end
£m £m £m £m £m £m £m £m £m
Assets
FVTPL(2):
Loans and advances 3,148 130 330 (1,537) 22 (898) (136) 1,059 11
Debt securities 3,846 (49) 104 (157) 378 (1,207) (133) 2,782 (165)
Equity shares 793 (49) 133 — 22 (151) (37) 711 (48)
Derivatives 10,265 (3,672) (211) — 1,811 (1,301) (463) 6,429 (1,079)
FVTPL assets 18,052 (3,640) 356 (1,694) 2,233 (3,557) (769) 10,981 (1,281)
AFS(3):
Debt securities 3,102 (376) (929) — 128 (491) (109) 1,325 (9)
Equity shares 325 (141) 632 — 53 (75) (45) 749 (51)
AFS assets 3,427 (517) (297) — 181 (566) (154) 2,074 (60)
Total assets 21,479 (4,157) 59 (1,694) 2,414 (4,123) (923) 13,055 (1,341)
Liabilities
Deposits 290 43 (217) — 15 (23) (5) 103 —
Debt securities in issue 4,362 57 (1,682) — 493 (638) (247) 2,345 (41)
Short positions 41 (45) 188 — 4 (4) — 184 12
Derivatives 4,035 (215) (978) — 76 (744) (187) 1,987 (244)
Other financial liabilities 257 ————(242) (14) 1 —
Total liabilities 8,985 (160) (2,689) — 588 (1,651) (453) 4,620 (273)
Note:
(1) Net losses recognised in the income statement and statement of comprehensive income were £4,257 million and £60 million respectively. Net losses on FVTPL assets and liabilities of £3,800
million were included in income from trading activities. £457 million net losses relating to AFS assets were recorded within interest income, dividend income and impairment losses as appropriate.
(2) FVTPL: Fair value through profit or loss.
(3) AFS: Available-for-sale.
Assets reduced in the year due to disposals, write downs, transfers and
reclassifications. Decrease in loans and advances to customers of
£2,089 million primarily reflected the reclassification of certain leveraged
and real estate finance loans from held-for-trading to loans and
receivables in first half of the year. The decrease in debt securities of
£2,841 million reflects wind-down of the US fund derivative portfolio,
£929 million of available-for-sale debt securities transferred to level 2
due to increased observability as well as liquidations and write-downs.
Derivative assets included hedges with CDPCs, illiquid credit and
interest rate derivatives.
The decrease in debt securities in issue is due to a transfer to level 2 of
£1,600 million of constant proportion portfolio insurance notes reflecting
the minimal residual equity component within these notes at 31
December 2009.
Sales and settlements include £577 million of derivative assets and
£437 million of derivative liabilities relating to Sempra included in
disposal groups in 2009.
Additionally, £1,533 million of non-G10 government debt securities,
foreign exchange derivatives (assets – £1,846 million, liabilities – £1,836
million) were transferred from level 1 to level 2 reflecting refinements of
hierarchy level classification in 2009.