RBS 2009 Annual Report Download - page 75
Download and view the complete annual report
Please find page 75 of the 2009 RBS annual report below. You can navigate through the pages in the report by either clicking on the pages listed below, or by using the keyword search tool below to find specific information within the annual report.-
 1
1 -
2
-
3
-
4
-
5
-
6
-
7
-
8
-
9
-
10
-
11
-
12
-
13
-
14
-
15
-
16
-
17
-
18
-
19
-
20
-
21
-
22
-
23
-
24
-
25
-
26
-
27
-
28
-
29
-
30
-
31
-
32
-
33
-
34
-
35
-
36
-
37
-
38
-
39
-
40
-
41
-
42
-
43
-
44
-
45
-
46
-
47
-
48
-
49
-
50
-
51
-
52
-
53
-
54
-
55
-
56
-
57
-
58
-
59
-
60
-
61
-
62
-
63
-
64
-
 65
65 -
 66
66 -
 67
67 -
 68
68 -
 69
69 -
 70
70 -
 71
71 -
 72
72 -
 73
73 -
 74
74 -
 75
75 -
 76
76 -
 77
77 -
 78
78 -
 79
79 -
 80
80 -
 81
81 -
 82
82 -
 83
83 -
 84
84 -
 85
85 -
86
-
87
-
88
-
89
-
90
-
91
-
92
-
93
-
94
-
95
-
96
-
97
-
98
-
99
-
100
-
101
-
102
-
103
-
104
-
105
-
106
-
107
-
108
-
109
-
110
-
111
-
112
-
113
-
114
-
115
-
116
-
117
-
118
-
119
-
120
-
121
-
122
-
123
-
124
-
125
-
126
-
127
-
128
-
129
-
130
-
131
-
132
-
133
-
134
-
135
-
136
-
137
-
138
-
139
-
140
-
141
-
142
-
143
-
144
-
145
-
146
-
147
-
148
-
149
-
150
-
151
-
152
-
153
-
154
-
155
-
156
-
157
-
158
-
159
-
160
-
161
-
162
-
163
-
164
-
165
-
166
-
167
-
168
-
169
-
170
-
171
-
172
-
173
-
174
-
175
-
176
-
177
-
178
-
179
-
180
-
181
-
182
-
183
-
184
-
185
-
186
-
187
-
188
-
189
-
190
-
191
-
192
-
193
-
194
-
195
-
196
-
197
-
198
-
199
-
200
-
201
-
202
-
203
-
204
-
205
-
206
-
207
-
208
-
209
-
210
-
211
-
212
-
213
-
214
-
215
-
216
-
217
-
218
-
219
-
220
-
221
-
222
-
223
-
224
-
225
-
226
-
227
-
228
-
229
-
230
-
231
-
232
-
233
-
234
-
235
-
236
-
237
-
238
-
239
-
240
-
241
-
242
-
243
-
244
-
245
-
246
-
247
-
248
-
249
-
250
-
251
-
252
-
253
-
254
-
255
-
256
-
257
-
258
-
259
-
260
-
261
-
262
-
263
-
264
-
265
-
266
-
267
-
268
-
269
-
270
-
271
-
272
-
273
-
274
-
275
-
276
-
277
-
278
-
279
-
280
-
281
-
282
-
283
-
284
-
285
-
286
-
287
-
288
-
289
-
290
-
291
-
292
-
293
-
294
-
295
-
296
-
297
-
298
-
299
-
300
-
301
-
302
-
303
-
304
-
305
-
306
-
307
-
308
-
309
-
310
-
311
-
312
-
313
-
314
-
315
-
316
-
317
-
318
-
319
-
320
-
321
-
322
-
323
-
324
-
325
-
326
-
327
-
328
-
329
-
330
-
331
-
332
-
333
-
334
-
335
-
336
-
337
-
338
-
339
-
340
-
341
-
342
-
343
-
344
-
345
-
346
-
347
-
348
-
349
-
350
-
351
-
352
-
353
-
354
-
355
-
356
-
357
-
358
-
359
-
360
-
361
-
362
-
363
-
364
-
365
-
366
-
367
-
368
-
369
-
370
-
371
-
372
-
373
-
374
-
375
-
376
-
377
-
378
-
379
-
380
-
381
-
382
-
383
-
384
-
385
-
386
-
387
-
388
-
389
-
390
 |
 |

73RBS Group Annual Report and Accounts 2009
Business review
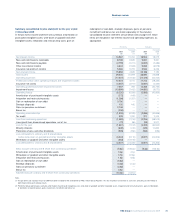
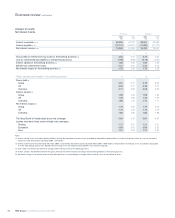
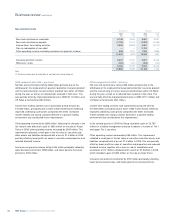
Summary consolidated income statement for the year ended
31 December 2009
In the pro forma income statement set out below, amortisation of
purchased intangible assets, write-down of goodwill and other
intangible assets, integration and restructuring costs, gain on
redemption of own debt, strategic disposals, gains on pensions
curtailment and bonus tax are shown separately. In the statutory
consolidated income statement set out below and on page 241, these
items are included in non-interest income and operating expenses, as
appropriate.
Pro forma Statutory
Restated (1) Restated(1)
2009 2008 2009 2008
£m £m £m £m
Net interest income 13,567 15,764 16,504 18,675
Fees and commissions receivable 8,738 8,845 9,831 9,831
Fees and commissions payable (2,790) (2,411) (2,822) (2,386)
Other non-interest income 4,644 (7,308) 9,633 (6,578)
Insurance net premium income 5,266 5,709 5,544 6,326
Non-interest income 15,858 4,835 22,186 7,193
Total income 29,425 20,599 38,690 25,868
Operating expenses (17,401) (16,188) (21,478) (54,202)
Profit/(loss) before other operating charges and impairment losses 12,024 4,411 17,212 (28,334)
Insurance net claims (4,357) (3,917) (4,857) (4,430)
Operating profit/(loss) before impairment losses 7,667 494 12,355 (32,764)
Impairment losses (13,899) (7,432) (14,950) (8,072)
Operating loss (2) (6,232) (6,938) (2,595) (40,836)
Amortisation of purchased intangible assets (272) (443) ——
Integration and restructuring costs (1,286) (1,357) ——
Gain on redemption of own debt 3,790 ———
Strategic disposals 132 442 ——
Gains on pensions curtailment 2,148 ———
Bonus tax (208) ———
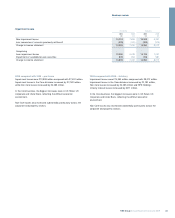
Operating loss before tax (1,928) (8,296) (2,595) (40,836)
Tax credit 339 1,280 371 2,323
Loss from continuing operations (1,589) (7,016) (2,224) (38,513)
(Loss)/profit from discontinued operations, net of tax (72) (86) (99) 3,971
Loss for the year (1,661) (7,102) (2,323) (34,542)
Minority interests (648) (412) (349) 10,832
Preference shares and other dividends (935) (596) (935) (596)
Loss attributable to ordinary and B shareholders
before write-down of goodwill and other intangible assets (3,244) (8,110) (3,607) (24,306)
Write-down of goodwill and other intangible assets (363) (16,196) ——
Loss attributable to ordinary and B shareholders (3,607) (24,306) (3,607) (24,306)
Basic loss per ordinary and B share from continuing operations (6.3p) (146.2p) (6.3p) (146.2p)
Amortisation of purchased intangible assets 0.4p 2.1p
Write-down of goodwill and other intangible assets 0.7p 97.8p
Integration and restructuring costs 1.6p 5.9p
Gain on redemption of own debt (6.8p) —
Strategic disposals (0.2p) (2.7p)
Gains on pensions curtailment (3.0p) —
Bonus tax 0.4p —
Adjusted loss per ordinary and B share from continuing operations (13.2p) (43.1p)
Note:
(1) The pro forma and statutory results for 2008 have been restated for the amendment to IFRS 2 ‘Share-based Payment’. This has resulted in an increase in staff costs amounting to £169 million in
both the pro forma and statutory results.
(2) Pro forma Group operating loss excludes amortisation of purchased intangible assets, write-down of goodwill and other intangible assets, integration and restructuring costs, gain on redemption
of own debt, strategic disposals, gains on pensions curtailment and bonus tax.