RBS 2009 Annual Report Download - page 288
Download and view the complete annual report
Please find page 288 of the 2009 RBS annual report below. You can navigate through the pages in the report by either clicking on the pages listed below, or by using the keyword search tool below to find specific information within the annual report.-
 1
1 -
2
-
3
-
4
-
5
-
6
-
7
-
8
-
9
-
10
-
11
-
12
-
13
-
14
-
15
-
16
-
17
-
18
-
19
-
20
-
21
-
22
-
23
-
24
-
25
-
26
-
27
-
28
-
29
-
30
-
31
-
32
-
33
-
34
-
35
-
36
-
37
-
38
-
39
-
40
-
41
-
42
-
43
-
44
-
45
-
46
-
47
-
48
-
49
-
50
-
51
-
52
-
53
-
54
-
55
-
56
-
57
-
58
-
59
-
60
-
61
-
62
-
63
-
64
-
65
-
66
-
67
-
68
-
69
-
70
-
71
-
72
-
73
-
74
-
75
-
76
-
77
-
78
-
79
-
80
-
81
-
82
-
83
-
84
-
85
-
86
-
87
-
88
-
89
-
90
-
91
-
92
-
93
-
94
-
95
-
96
-
97
-
98
-
99
-
100
-
101
-
102
-
103
-
104
-
105
-
106
-
107
-
108
-
109
-
110
-
111
-
112
-
113
-
114
-
115
-
116
-
117
-
118
-
119
-
120
-
121
-
122
-
123
-
124
-
125
-
126
-
127
-
128
-
129
-
130
-
131
-
132
-
133
-
134
-
135
-
136
-
137
-
138
-
139
-
140
-
141
-
142
-
143
-
144
-
145
-
146
-
147
-
148
-
149
-
150
-
151
-
152
-
153
-
154
-
155
-
156
-
157
-
158
-
159
-
160
-
161
-
162
-
163
-
164
-
165
-
166
-
167
-
168
-
169
-
170
-
171
-
172
-
173
-
174
-
175
-
176
-
177
-
178
-
179
-
180
-
181
-
182
-
183
-
184
-
185
-
186
-
187
-
188
-
189
-
190
-
191
-
192
-
193
-
194
-
195
-
196
-
197
-
198
-
199
-
200
-
201
-
202
-
203
-
204
-
205
-
206
-
207
-
208
-
209
-
210
-
211
-
212
-
213
-
214
-
215
-
216
-
217
-
218
-
219
-
220
-
221
-
222
-
223
-
224
-
225
-
226
-
227
-
228
-
229
-
230
-
231
-
232
-
233
-
234
-
235
-
236
-
237
-
238
-
239
-
240
-
241
-
242
-
243
-
244
-
245
-
246
-
247
-
248
-
249
-
250
-
251
-
252
-
253
-
254
-
255
-
256
-
257
-
258
-
259
-
260
-
261
-
262
-
263
-
264
-
265
-
266
-
267
-
268
-
269
-
270
-
271
-
272
-
273
-
274
-
275
-
276
-
277
-
 278
278 -
 279
279 -
 280
280 -
 281
281 -
 282
282 -
 283
283 -
 284
284 -
 285
285 -
 286
286 -
 287
287 -
 288
288 -
 289
289 -
 290
290 -
 291
291 -
 292
292 -
 293
293 -
 294
294 -
 295
295 -
 296
296 -
 297
297 -
 298
298 -
299
-
300
-
301
-
302
-
303
-
304
-
305
-
306
-
307
-
308
-
309
-
310
-
311
-
312
-
313
-
314
-
315
-
316
-
317
-
318
-
319
-
320
-
321
-
322
-
323
-
324
-
325
-
326
-
327
-
328
-
329
-
330
-
331
-
332
-
333
-
334
-
335
-
336
-
337
-
338
-
339
-
340
-
341
-
342
-
343
-
344
-
345
-
346
-
347
-
348
-
349
-
350
-
351
-
352
-
353
-
354
-
355
-
356
-
357
-
358
-
359
-
360
-
361
-
362
-
363
-
364
-
365
-
366
-
367
-
368
-
369
-
370
-
371
-
372
-
373
-
374
-
375
-
376
-
377
-
378
-
379
-
380
-
381
-
382
-
383
-
384
-
385
-
386
-
387
-
388
-
389
-
390
 |
 |
Notes on the accounts continued
RBS Group Annual Report and Accounts 2009286
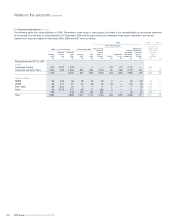
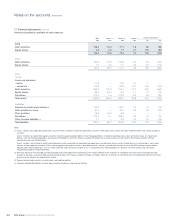
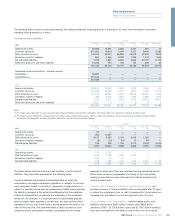
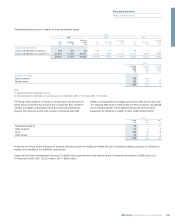
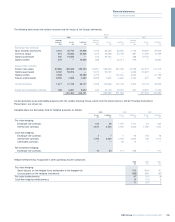
11 Financial instruments continued
Other asset-backed and corporate debt securities
Where observable market prices for a particular debt security are not
available, the fair value will typically be determined with reference to
observable market transactions in other related products, such as
similar debt securities or credit derivatives. Assumptions are made
about the relationship between the individual debt security and the
available benchmark data. Where significant management judgement
has been applied in identifying the most relevant related product, or in
determining the relationship between the related product and the
instrument itself, the valuation is shown in level 3.
Equity shares
Private equity investments include unit holdings and limited partnership
interests primarily in corporate private equity funds, debt funds and fund
of hedges funds. Externally managed funds are valued using recent
prices where available. Where not available, the fair value of investments
in externally managed funds is generally determined using statements
or other information provided by the fund managers.
The Group considers that valuations may rely significantly on the
judgements and estimates made by the fund managers, particularly in
assessing private equity components. Given the decline in liquidity in
world markets, and the level of subjectivity, these are included in level 3.
Derivatives
Derivatives are priced using quoted prices for the same or similar
instruments where these are available. However, the majority of
derivatives are valued using pricing models. Inputs for these models are
usually observed directly in the market, or derived from observed prices.
However, it is not always possible to observe or corroborate all model
inputs. Unobservable inputs used are based on estimates taking into
account a range of available information including historic analysis,
historic traded levels, market practice, comparison to other relevant
benchmark observable data and consensus pricing data.
Credit derivatives – APS
The Group has purchased credit protection over a portfolio of specified
assets and exposures (covered assets) from HMT with a par value of
£282 billion. The protection is subject to a first loss of £60 billion and
covers 90% of subsequent losses. Once a covered asset has
experienced a trigger event, losses and recoveries in respect of that
asset are included in the balance receivable under the APS. Receipts
from HMT will, over time, amount to 90% of cumulative losses (net of
cumulative recoveries) on the portfolio of covered assets less the first
loss amount.
The Group has a right to terminate the APS at any time provided that the
Financial Services Authority has confirmed in writing to HMT that it has
no objection to the proposed termination. On termination the Group
must pay HMT the higher of the regulatory capital relief received and
£2.5 billion less premiums paid plus the aggregate of amounts received
from the UK Government under the APS. In consideration for the
protection provided by the APS, the Group paid an initial premium of
£1.4 billion on 31 December 2009. A further premium of £700 million is
payable on 3 December 2010 and subsequently annual premiums of
£500 million until the earlier of 2099 and the termination of the
agreement.
The APS is a single contract providing credit protection in respect of the
covered assets. Under IFRS, credit protection is treated either as a
financial guarantee contract or as a derivative financial instrument
depending on the terms of the agreement and the nature of the
protected assets and exposures. The Group has concluded, principally
because the covered portfolio includes significant exposure in the form
of derivatives, that the APS does not meet the criteria to be treated as a
financial guarantee contract. The contract has therefore been accounted
for as a derivative financial instrument. It was recognised initially and
measured subsequently at fair value with changes in fair value
recognised in profit or loss. There is no change in the recognition and
measurement of the covered assets as a result of the APS.
Where protection is provided on a particular seniority of exposure, as is
the case with the APS, which requires initial losses to be taken by the
Group, it is termed “tranched” protection. The model being used to
value the APS – Gaussian Copula model with stochastic recoveries is
used by the Group to value tranches traded by the exotic credit desk
and is a model that is currently used within the wider market.
The option to exit the APS is not usually present in such tranched trades
and consequently, there is no standard market practice for reflecting this
part of the trade within the standard model framework. The approach
that has been adopted assumes that the Group will not exit the trade
before the minimum level of fees has been paid and at this point it will
be clear whether it should exit the trade or not. The APS derivative is
valued as the payment of the minimum level of fees in return for
protection receipts which are in excess of both the first loss and the
total future premiums.
The model primarily uses the following information, obtained in relation
to each individual asset: notional, maturity, probability of default and
expected recovery rate given default. Other required information is the
correlation between the underlying assets; and the size of the first loss.
The APS protects a wide range of asset types, and hence, the
correlation between the underlying assets cannot be observed from
market data. In the absence of this, the Group determines a reasonable
level for this input. The expected recovery rate given default is based on
internally assessed levels. The probability of default is calculated with
reference to data observable in the market. Where possible, data is
obtained for each asset within the APS, but for most of the assets, such
observable data does not exist. Therefore, this important input is
determined from information available for portfolios of similarly rated
entities. As the inputs into the valuation model are not all observable the
APS derivative is a level 3 asset. The value of the credit protection at 31
December 2009 was £1.4 billion, representing the initial premium paid
at 31 December 2009.